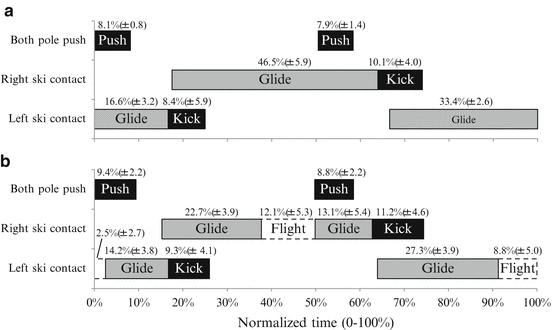
Fig. 21.1
A typical example of ski-sensor voltage during (a) a medium-speed trial, and (b) a high speed trial

Fig. 21.2
Phase diagram of V2 skating for (a) a medium-speed trial and (b) a high-speed trial

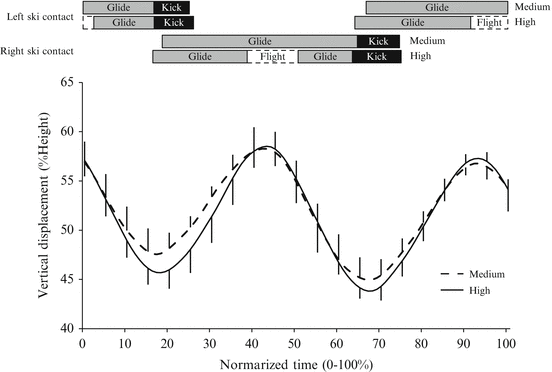
Fig. 21.3
Mean values of the vertical displacement of the center of mass
21.2.4 Discussion
In this study, a flight phase was observed in the high-speed trials but not in the medium-speed ones. This result implies that the occurrence of the flight phase was related to V2 skating velocity.
The voltage in the middle of the glide phase during high-speed trials was 0 V (Fig. 21.1), and thus, it was confirmed that the ski came completely off the ground. Additionally, since the other ski and both poles were not in contact with the ground, it is likely that the body was in a state of complete flight during this phase (Fig. 21.2). Furthermore, a comparison of the skating motions at different velocities showed that changes in the vertical displacement of the center of mass did not affect the flight phase (Fig. 21.3). This fact suggest that, although the skis definitely floated above the snow during the flight phase, the change in terms of differences in kinematics was negligible.
The flight phase occurred over an extremely short period of time. Therefore, the difficulty in specification, given the measurement precision in this research, is also considered a factor in making it virtually impossible to clarify the mechanism of the flight phase. The mean flight time was 0.18 s (Table 21.1). Assuming that the flight phase is a parabolic motion of the center of mass, the jump height in the vertical direction is only 3.7 cm, if it is estimated from the flight time. In other words, the change in motion accompanying the occurrence of the flight phase is negligible. This implies that it does not occur owing to a large jump in the forward direction, or by lifting skis high off the snow surface. To analyze this small change will require more refined kinematic analysis techniques, as well as mechanical analysis through measurement of the ground reaction force.
Table 21.1
Data and results relating to cycle characteristics, upper body work, and leg work
Low | Medium | High | |
|---|---|---|---|
Cycle characteristics | |||
Velocity (m/s) | 3.50 ± 0.21 | 5.09 ± 0.24 | 6.31 ± 0.55 |
Cycle rate (Hz) | 0.85 ± 0.07 | 1.05 ± 0.11** | 1.29 ± 0.12***, a |
Cycle length (m) | 4.12 ± 0.43 | 4.88 ± 0.54* | 4.92 ± 0.50** |
Upper body work | |||
Poling time (s) | 0.34 ± 0.04 | 0.26 ± 0.04** | 0.22 ± 0.02***, a |
Swing time (s) | 0.84 ± 0.08 | 0.70 ± 0.07** | 0.56 ± 0.07***, a |
Poling peak force (N) | 53.62 ± 15.31 | 87.73 ± 26.96* | 138.21 ± 72.64* |
Poling mean force (N) | 36.3 ± 10.57 | 56.78 ± 20.16* | 79.8 ± 44.32* |
Leg work | |||
Glide time (s) | 0.86 ± 0.09 | 0.64 ± 0.10** | 0.50 ± 0.06***, a |
Glide peak force (N) | 680 ± 40 | 695 ± 44 | 743 ± 41* |
Glide mean force (N) | 531 ± 34 | 503 ± 32 | 466 ± 41* |
Push-off time (s) | 0.50 ± 0.09 | 0.46 ± 0.06 | 0.42 ± 0.04 |
Push-off peak force (N) | 699 ± 36 | 863 ± 53*** | 991 ± 77***, a |
Push-off mean force (N) | 526 ± 23 | 573 ± 23* | 583 ± 34*** |
Lowest force (N) | 480 ± 41 | 393 ± 59** | 251 ± 96**, a |
Poling peak force per push-off peak force (%) | 7.7 ± 2.1 | 10.1 ± 3.0 | 13.7 ± 6.1 |
21.3 Cycle Characteristics and Reaction Force Profiles in V2 Skating Techniques of Female Cross-Country Skiers
21.3.1 Purpose
The purpose of this study is to determine the cycle characteristics and the pole and ski reaction forces of female cross-country skiers during V2 skating at low to high velocities.
21.3.2 Methods
Subjects
Nine female elite cross-country skiers (mean ± SD: age, 20.2 ± 1.0 years; height, 158.7 ± 5.0 cm; weight, 56.5 ± 4.3 kg) gave their informed consent for participation in this experiment. Their mean maximal oxygen consumption VO2max (56.8 ± 8.4 ml/kg/min) was measured during Nordic walking on a treadmill using an ergospirometry system.
Pole and Ski Sensors
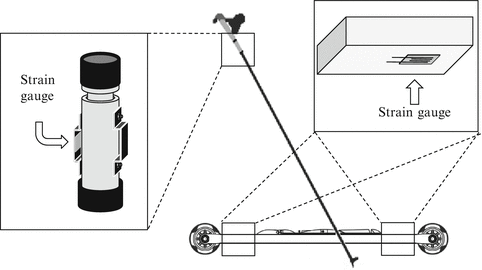
All subjects used racing poles (Yoko Platinum Power Grip, Karhu Sporting Goods Oy, Finland). Specially made sensors were mounted on the right and left poles (Fig. 21.4). In the test, special roller skis were fabricated using square pipe aluminum (600 × 40 × 30 mm), bearing, and tire (610 mm, Marwe Oy, Hyvinkään Kumi Oy). To measure the ski reaction force on the roller ski, strain gages (N11-FA-5-1000-11, Showa Measuring Instruments Co. Ltd., Japan) were attached to the front and rear of the right and left roller ski frames (Fig. 21.4).


Fig. 21.4
Settings for pole and roller ski sensors
Data Collection
Testing was conducted on a flat, straight outdoor asphalt track. After accelerating over a 50 m section, the participant’s skating time over the next 20 m was measured using two photo sensors (Wireless Sprint System, Brower Timing Systems, USA). Each subject was instructed to ski at three different speeds (low: 3.5 m/s, medium: 5.0 m/s, and maximal effort).
Data Analysis
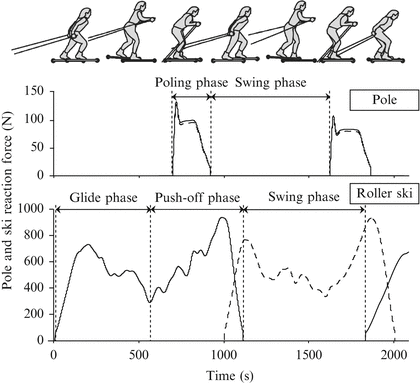
In this study, one cycle was defined as running from the start of the ground contact of both poles to the start of their subsequent ground contact. The upper body work was divided into the poling and swing phases used by the pole reaction forces. The leg work was categorized into the glide, push-off, and swing phases used by the ski reaction forces (Fig. 21.5). The zero level of the pole and ski reaction forces was defined as the swing phase. The poling phase was the phase during which the pole reaction force was greater than zero. The glide and push-off phases were determined based on the point of lowest value among the bimodal ski reaction forces. The glide phase started with the placing of the roller ski on the ground, leading to a first peak in the force curve. It ended at the point of minimum value of the ski force, before it attained a second peak. The push-off phase started at the point of minimum force and ended when the ski reaction force decreased to zero. The duration of the poling, swing, glide, and push-off phases were calculated, and the bimodal peak values during the glide and push-off phases were defined as the peak force during each phase. The ratio of the peak force during the poling phase to the peak force during the push-off phase was calculated. The lowest force was determined as the minimum value between the glide and push-off peak forces.


Fig. 21.5
Definitions of poling and ski phases during V2-skating
Statistics
The following data were obtained from each trial: velocity, cycle rate, cycle length, and peak and mean pole reaction forces during the poling phase; the lowest ski reaction force during the glide phase; the peak and mean ski reaction forces during the glide and push-off phases; and the poling, swing, glide, and push-off times. The variables were reported as the mean ± SD. They were compared across velocities using a one-way analysis of variance with repeated measures. When the F-values were significant, individual comparisons were made using Bonferroni post hoc analysis. Moreover, the correlation between the peak force during the push-off phase and the lowest force were analyzed using Pearson’s product–moment correlation analysis. Values of 0.05, 0.01, and 0.001 were accepted as the levels of statistical significance.
21.3.3 Results
Cycle Characteristics
The cycle characteristics and kinetic parameters are listed in Table 21.1. The cycle rate gradually increased, from low to high velocities, up to 1.29 Hz (all P < 0.05), whereas the cycle length increased only from low to medium velocities (all P < 0.05).
Arm Actions
The poling times decreased from low to medium velocities (P < 0.05), whereas the swing times gradually decreased across velocities, from low to high (all P < 0.05). The ratios of the poling and swing times, in each cycle, remained constant across velocities. The poling peak and mean forces increased from low to medium velocities (all P < 0.05).
Stay updated, free articles. Join our Telegram channel

Full access? Get Clinical Tree


