Fig. 27.1
Experimental setup and the space-coordinate system (X global, Y global, and Z global) with its origin at the rear point of home plate
Data involving the location of the bat top, the bat grip, and the launched ball were obtained from images, digitized, and analyzed using a motion analysis system, Frame Dias IV (DKH, Japan). One frame (1 ms) before the frame which captured contact of the ball and bat was selected as the frame to be utilized for analysis of ball-bat location. Three-dimensional coordinates were obtained using the Direct Linear Transformation method (DLT) with an approximately 2 m × 2 m × 2 m size radial calibration structure with 68 reference points and five reference markers set vertical and horizontal relative to the ground. The right-hand orthogonal reference frame was defined by Xglobal, Yglobal, and Zglobal-axes with the origin at the rear point of home plate (Fig. 27.1). The Yglobal-axis was directed from home plate to the pitcher’s plate; and the Zglobal-axis indicated a vertically upward direction. The Xglobal-axis was defined as the cross product of the Yglobal and Zglobal-axes. For analysis of left-handed batters, a left-hand coordinate system with the same Yglobal and Zglobal-axes as the right-hand coordinate system was utilized. For calibration, poles with three reference markers (0, 0.75, and 1.5 m from the bottom) were vertically set at nine different locations within a 1.5 m × 1.5 m square on the ground. A recording of the calibration points with cameras 1 and 2 was conducted both before and after the batting tasks. To test the accuracy and reliability of this measurement method, one investigator digitized two reference markers on a swung bat for five frames on two separate occasions. The difference between the actual value (0.450 m) and calculated value (mean ± standard deviation = 0.453 ± 0.0004) was less than 2 %. For the test-retest reliability of the distance, r was = 0.953.
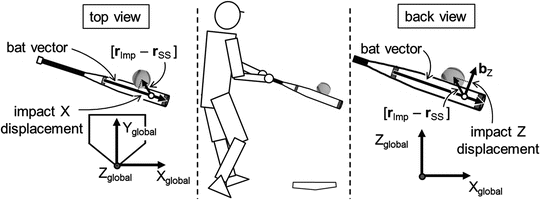
To clarify the spatial relationship between the bat’s sweet spot and the ball at the point of impact, the impact Z displacement and the impact X displacement were calculated (Fig. 27.2). First, the bat vector was defined as lying on the long axis of the bat and as being oriented from the bat grip to the top. Then, the impact X displacement can be computed as

where the  = unit vector that is parallel to the bat vector directed away from the sweet spot = position of the ball center at impact, and
  = position of the sweet spot at impact. The impact X displacement provides a measure of hitting accuracy in the direction parallel to the bat. The bat coordinate system was adopted to show the ball location on bat barrel at the moment of contact. The impact Z displacement can be computed as

where the  = unit vector that is perpendicular to the bat vector directed upward in the vertical plane,
  = position of the ball center at impact, and
  = position of the sweet spot at impact. The impact Z displacement provides a measure of hitting accuracy in the direction perpendicular to the bat.


(27.1)
 = unit vector that is parallel to the bat vector directed away from the sweet spot = position of the ball center at impact, and
  = position of the sweet spot at impact. The impact X displacement provides a measure of hitting accuracy in the direction parallel to the bat. The bat coordinate system was adopted to show the ball location on bat barrel at the moment of contact. The impact Z displacement can be computed as
(27.2)
 = unit vector that is perpendicular to the bat vector directed upward in the vertical plane,
  = position of the ball center at impact, and
  = position of the sweet spot at impact. The impact Z displacement provides a measure of hitting accuracy in the direction perpendicular to the bat.
Fig. 27.2
Top view (left) and back view (right) at the moment of ball bat impact by a batter (middle). Impact Z displacement is the distance between the ball center (r Imp) and the sweet spot of the bat (white circle) (r SS) in the direction of b Z
27.2.4 Procedure for the Observing a Pitch Task
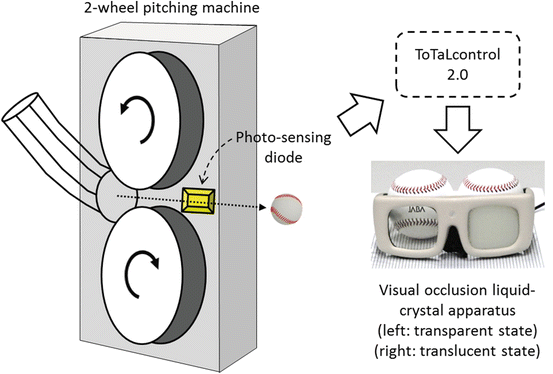
The second task, Observing a Pitch Task, was designed to indicate the location of a pitch right after it passed home plate (See Extras.). Location and settings of the pitching machine and cameras were identical to those in the Hitting a Pitch Task. Twenty fastballs which arrived at different locations were thrown for each subject. Subjects were instructed to observe pitches thrown by the pitching machine and then indicate the location of the ball with a bat based on their judgment right after the ball passed home plate. This procedure was designed in order to eliminate the timing accuracy and bat control components of batting accuracy. It was also necessary to eliminate visual information about the ball’s trajectory after it passed the plate. This information would not normally be available to a batter, but could be potentially be utilized by the subjects to locate the ball’s position. For this reason, the subjects wore a visual occlusion liquid-crystal apparatus (PLATO, Translucent Technologies Inc., USA) (Fig. 27.3). The timing of visual occlusion was regulated by software (ToTaLcontrol 2.0, Translucent Technologies Inc., USA) and subjects’ vision was occluded 350 ms after a ball passed a photo-sensing diode (PLDM-10, Sankei Machinery, Japan, Fig. 27.2). This occurred about 100 ms before the ball passed home plate. The visual occlusion lasted for 150 ms. The same bat and ball as the Hitting a Pitch Task were used in this observation task.


Fig. 27.3
Image of the two-wheel pitching machine with the photo-sensing diode and visual occlusion liquid-crystal apparatus
27.2.5 Data Collection and Analysis for the Observing a Pitch Task
The same cameras and coordinate system as used in the Hitting a Pitch Task were utilized in this task. Pitch trajectory during the period between 150 ms before and 150 ms after the ball passed home plate was recorded. Next, video cameras recorded the subjects for 30 ms while they were indicating their perceived location of the passed ball. Calculation of estimated ball-bat contact location was conducted as follows:
1.
The locations of markers on the bat while the subject was indicating his perceived ball location were digitized for one frame.
2.
For digitization of ball center, an experimenter digitized ten continuous frames of ball images which included the period of time when a launched ball was passing the vertical plane that contains the indicated bat.
3.
Displacement from the bat’s sweet spot to the ball center in the direction of Yglobal axis was calculated for each of the ten frames. If the optimal choice of the ten frames was made, Yglobal displacement became smaller and closer to zero during the first five frames and attained greater negative values during the last five frames.
4.
The frame before the Yglobal displacement decreased to less than 70 mm was considered to be the ball location just before ball-bat contact and was used to calculate the estimated ball-bat contact location.
27.2.6 Procedure for the Tee Ball Task
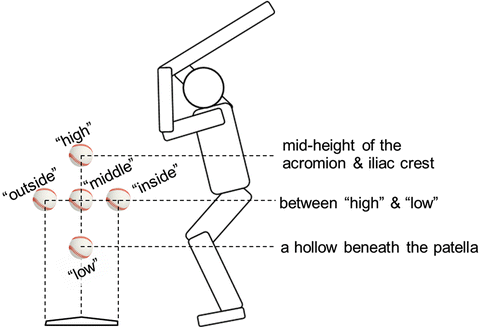
The third task, Tee Ball Task, was to hit a ball off a baseball tee (2ZA770, MIZUNO, Japan) from five different locations (Fig. 27.2), ten times at each location. Ball location was changed every trial in a randomized order. The same bat and ball as those in the Hitting a Pitch Task were used. Since the ball (target) was at rest on the tee, this task should assess the batter’s skill in bat control, while largely excluding skill in timing accuracy and visual perception. There were three kinds of ball location which were on the Yglobal axis with different heights, (a) the base of the patella=“low”, (b) mid-height between the acromion and iliac crest=“high”, (c) the midpoint between the “low” and “high”=“middle”. At the height of c, there were two other ball locations; (d) in which the ball was located 0.2 m towards the hitter in the Xglobal direction=“inside”, and (e) in which the ball was located 0.2 m away from the hitter in the Xglobal direction=“outside” (Fig. 27.4). Ball locations in the Yglobal direction were determined based on each subject’s characteriatics. The subjects were instructed to hit utilizing the same foot position as they did for the fastball hitting task. Three-minute-breaks were given after 10 trials to minimize the influence of fatigue.


Fig. 27.4
Five ball locations for the Tee Ball Task
27.2.7 Data Collection and Analysis for the Tee Ball Task
The same cameras and coordinate system as utilized in the Hitting a Pitch Task were employed in this task. The movement of bat and ball 150 ms before and after ball-bat contact was recorded from the same cameras and with the same settings as for the other tasks. The frame (1 ms) before the frame capturing contact of ball and bat was selected as the frame with which to analyze ball-bat location. The coordinate systems were the same as those utilized in the Hitting a Pitch Task.
27.2.8 Statistical Analyses
The subject’s ability to hit a pitch accurately was determined by the mean of distance (absolute value from the sweet spot) between the ball center and the sweet spot and the standard deviation of displacement (relative value from the sweet spot) of the ball center from the sweet spot in the Hitting a Pitch Task. Shorter ball-bat distance and smaller standard deviation of the displacement at the moment of impact indicated greater hitting accuracy.
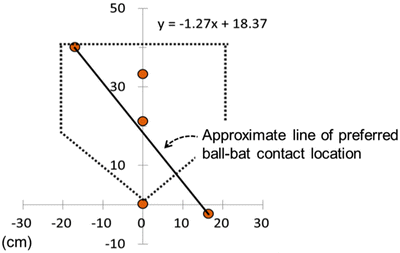
The mean of distance between the ball center and the sweet spot as well as the standard deviation of displacement of ball center from the sweet spot in the Observing a Pitch Task indicated the subject’s performance for the spatial perception of ball location. The mean of distance between the ball center and the sweet spot coupled with the standard deviation of displacement of ball center from the sweet spot in the Tee Ball Task indicated the subject’s performance in bat control – the batter’s ability to bring the bat to its intended location. The subject’s performance in timing accuracy was analyzed based on the mean distance between the ball-bat contact location and the “preferred impact location”. This was established from their preferred Yglobal ball location in the Tee Ball Task. First, an approximate equation of preferred ball locations on the XYglobal plane in each subject’s Tee Ball Task was calculated (Fig. 27.5). Then, the difference between the Yglobal value of ball-bat contact location in each trial of the Hitting a Pitch Task trial and the Yglobal value which was calculated by assigning Xglobal value in the trial to the appropriate equation was determined.


