Fig. 11.1
Multiplanar reformatted targeted three-dimensional T2 preparation echo coronary MRI depicting the right coronary artery (RCA), left main coronary artery (LM), and left circumflex (LCX). The in-plane spatial resolution is 0.7 × 1.0 mm. The sinoatrial node branch (SA) and an acute marginal (AM) branch of the RCA are also seen. Ao aorta (Reproduced with permission from Manning et al. [3])
In most cardiac magnetic resonance (CMR) protocols, ECG synchronization and breath holding techniques or respiratory gating are required to reduce motion artifact and improve spatial resolution. With superior temporal resolution, pharmaceutical rate control is not utilized as frequently as with other technologies, such as computed tomographic (CT) angiography.
MRI should not be used in some patients with internal metal objects such as aneurysm clips, intra-ocular foreign bodies, and most pacemakers. The advent of newer generation pacemakers that are MRI compatible is an area of active research and recent promise. CMR has been shown to be safe in patients with prosthetic heart valves, sternotomy wires, and bare metal or drug eluting coronary stents (regardless of stent type, even early after stent implantation), though it may introduce artifact [1] (Fig. 11.2).
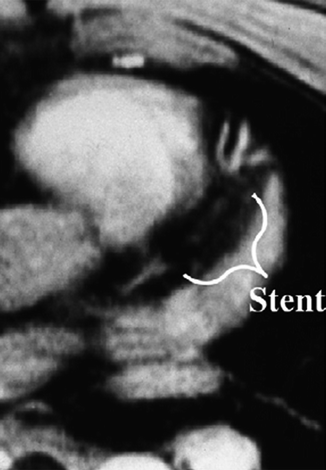

Fig. 11.2
Transverse, two-dimensional breath hold gradient-echo coronary MRI at the level of the left anterior descending coronary artery in a patient with a patent stent. Note the signal void (marker) corresponding to the site of the stent (Reproduced with permission from Manning et al. [3])
Claustrophobia is a relatively unique and important disadvantage with CMR. Furthermore, electrocardiography and telemetry can be unreliable while the patient is actively being scanned and image acquisition can be time consuming. Nephrogenic systemic fibrosis is a rare complication with intravenous gadolinium contrast, affecting primarily patients with moderate to severe baseline renal impairment (Fig. 11.3).
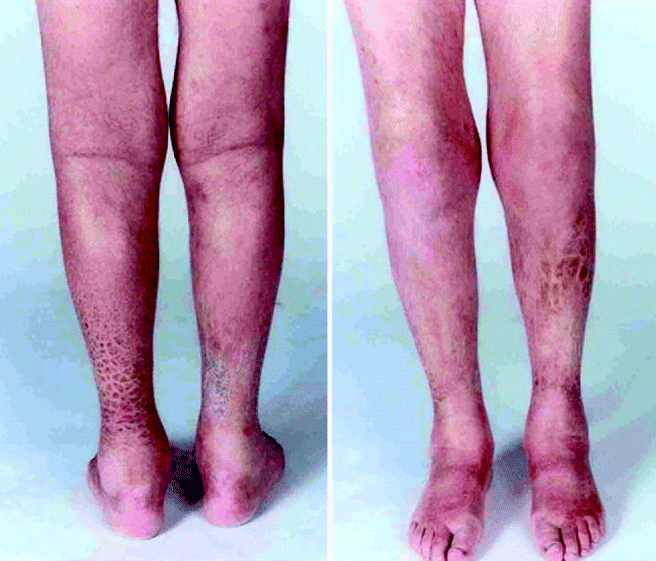

Fig. 11.3
Clinical photograph of the anterior and posterior legs of a patient with Von Hippel Lindau syndrome who developed nephrogenic systemic fibrosis after multiple contrast enhanced MRI scans of the neuraxis. Characteristic plaque-like induration is seen (Reproduced with permission from Gauden et al. [38])
A variety of MR imaging and acquisition methods are available to evaluate cardiovascular disease. A complete overview of these protocols is beyond the scope of this text. A few examples of standard techniques follow.
Gradient echo imaging, also known as the “bright blood” technique, is most commonly used with cine CMR to assess valvular and ventricular function. Without the use of intravenous contrast, blood appears bright against the myocardium, valves, and other cardiac structures, which appear relatively darker.
Coronary magnetic resonance angiography (CMRA) most typically uses T2 weighted images with fat saturation with blood appearing bright against the dark epicardial fat. Intravascular areas without such flow, such as areas of stenosis or obstruction, will likewise be dark (Figs. 11.4 and 11.7a). The addition of intravenous contrast can be used as well.
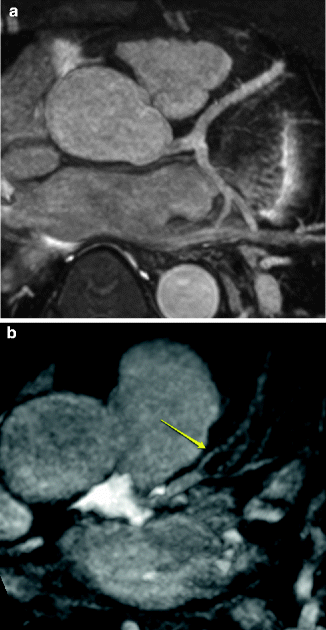

Fig. 11.4
(a) Normal origin of the left main, left anterior descending artery (LAD) originating from the left sinus of Valsalva. (b) Atherosclerotic disease of the LAD. Note the narrowing of the LAD distal to the diagonal branch (arrow) as well as the narrowing of the proximal diagonal branch
In contrast, T1 weighted, spin echo imaging, also known as “black blood” imaging, is best used for the evaluation of myocardial structure. Blood is dark and the cardiac tissues are relatively bright (Fig. 11.5).
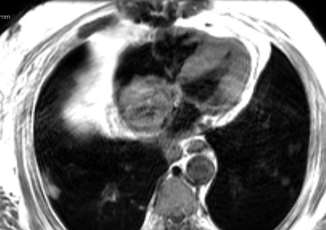

Fig. 11.5
Axial T1 weighted, spin echo image demonstrating a large mass in the right atrium
Contrast-enhanced CMR has several important uses in CMR. The most significant applications are contrast-enhanced myocardial perfusion (Figs. 11.6) used in MR stress testing as a correlate of various angiographic techniques including MR angiography (Figs. 11.7). Late contrast enhancement identifies areas of myocardial infarction and fibrosis (Fig. 11.8).
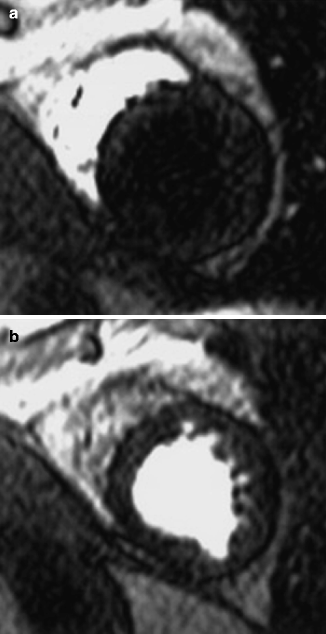
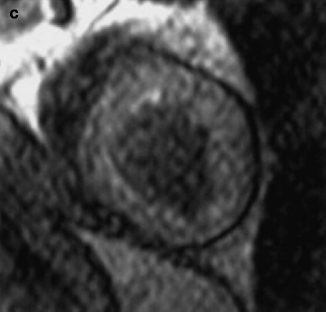
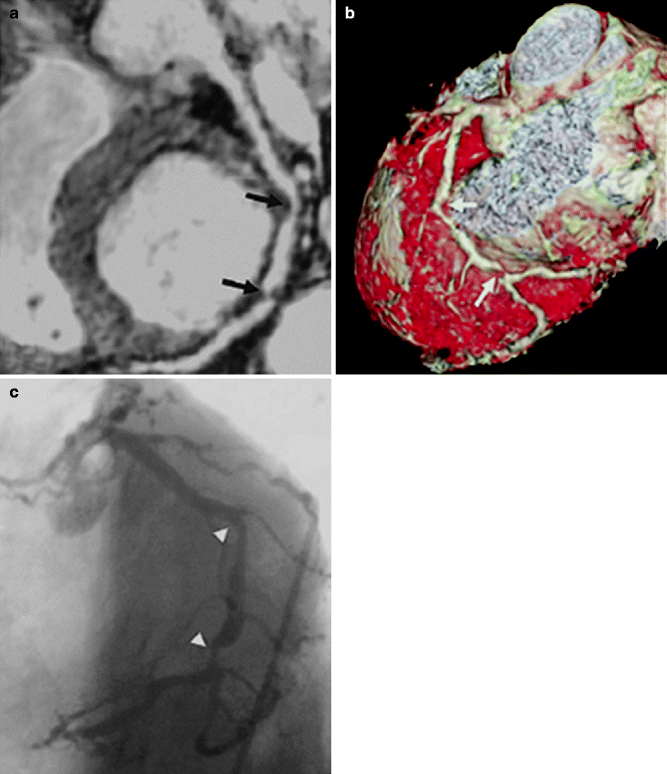
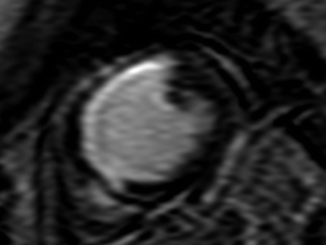


Fig. 11.6
(a–c) MR images of the transit of gadolinium bolus through right ventricle (a), left ventricle (b), and left ventricular myocardium (c). Note compact contrast bolus, with almost complete exit of contrast agent from right ventricle when passing through left ventricle (Reproduced with permission from Al-Saadi et al. [39])

Fig. 11.7
(a–c) A patient with stenosis in the left circumflex artery (LCX). (a) Curved multiplanar reconstruction demonstrates stenoses of LCX in two locations (black arrows). (b) Volume rendering method shows 3-dimensional view of LCX with stenoses (white arrows). (c) X-ray coronary angiography of the same artery confirms stenoses of LCX (arrowhead) (Reproduced with permission of Elsevier from Sakuma et al. [7])

Fig. 11.8
Late contrast-enhanced images of the left ventricle in shorten axis. Note the large transmural infarction (area of bright hyperenhancement) in the septum and anterior wall
Contrast-enhanced MR angiography utilizes intravenous administration of gadolinium based contrast agents. Similar to CT angiography, contrast-enhanced MR angiography images are obtained in a manner that allows for 3-D manipulations and reconstructions [2]. These sequences are primarily used for the evaluation of the non coronary vasculature.
Due to the inherent properties of different tissues proximal to the coronary arteries, “prepulses” can also be used to suppress the surrounding myocardium and epicardial fat [3] (Fig. 11.9).
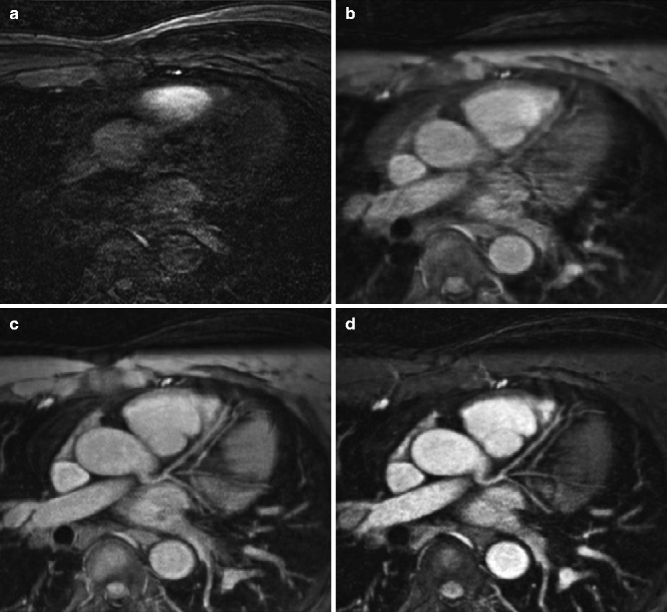

Fig. 11.9
(a–d) Transverse image at the level of the left main coronary artery and left anterior descending coronary artery in the same subject (a) in the absence of cardiac and respiratory gating. The incremental value of (b) ECG triggering with mid-diastolic data acquisition, navigator gating (c) with real-time motion correction, and T2 prepulse (d) are readily apparent (Reproduced with permission from Manning et al. [3])
Cardiac Magnetic Resonance Imaging
Clinically relevant cardiac magnetic resonance (CMR) imaging has been available since the early 1990s. CMR can provide physicians with useful cardiovascular anatomic and physiologic imaging.
Before reviewing the use of CMR for the detection of coronary atherosclerosis, it is important to understand current recommendations for its use. Because of the relatively recent development of the CMR technology, official indications for its use have not yet been published. However, in 2006, the first multidisciplinary “Appropriateness Use Criteria” document was developed to help guide clinicians in the application of this important imaging technology [4].
Appropriate and uncertain indications for the use of CMR are shown in Tables 11.1 and 11.2, respectively. The remainder of the investigated potential uses, including CMR for the angiographic detection of atherosclerosis, was deemed inappropriate (Fig. 11.10).
Table 11.1
Appropriate indications (median score 7–9)
Indications
Appropriateness criteria (median score)
Detection of CAD: symptomatic – evaluation of chest pain syndrome (use of vasodilator perfusion CMR or dobutamine stress function CMR)
3.
Intermediate pre-test probability of CA
A(7)
ECG uninterpretable OR unable to exercise
Detection of CAD: symptomatic – evaluation of intra-cardiac structures (use of MR coronary angiography)
8.
Evaluation of suspected coronary anomalies
A(8)
Risk assessment with prior test results (use of vasodilator perfusion CMR or dubutamine stress function CMR)
13.
Coronary angiography (catheterization of CT)
A(7)
Stenosis of unclear significance
Table 11.2
Uncertain indications (median score 4–6)
Indication
Appropriateness criteria (median score)
Detection of CAD: symptomatic – Evaluation of chest pain syndrome (use of vasodilator perfusion CMR or dobutamine stress function CMR)
2.
Intermediate pre-test probability of CAD
U(4)
ECG interpretable AND able to exercise
4.
High pre-test probability of CAD
U(5)
Detection of CAD: symptomatic – acute chest pain (use of vasodilator perfusion CMR or dubutamine stress function CMR)
9.
Intermediate pre-test probability of CAD
U(6)
No ECG changes and serial cardiac enzymes negative
Risk assessment with prior test results (use of vasodilator persuion CMR or dubutamine stress function CMR)
12.
Equivocal stress test (exercise, stress SPECT, or stress echo)
U(6)
Intermediate CHD risk (Framingham)
Risk assessment: preoperative evaluation for non-cardiac surgery – intermediate or high risk surgery (use of vasodilator perfusion CMR or dubutamine stress function CMR)
15.
Intermediate perioperative risk predictor
U(6)
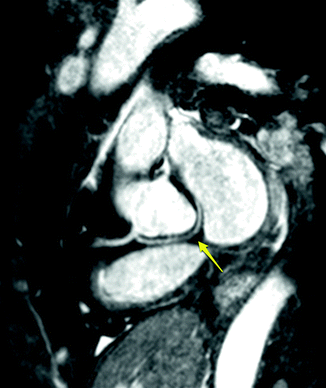
Fig. 11.10
Anomalous origin of the left circumflex artery from the right coronary with a course posterior to the aorta. Yellow arrow points to the circumflex artery
Coronary angiography is more challenging than other forms of MR angiography due to the motion of the heart, its relatively small and tortuous vessels, and artifact from adjacent adipose and myocardial tissue [3].
Accuracy for Detecting Coronary Artery Disease: Angiography
One of the early, larger prospective multi-center studies evaluating CMR angiography (CMRA) in patients with planned invasive angiography was published by Kim et al. in 2001 [5]. They utilized a gated, free breathing T2-weighted gradient echo sequence after the administration of sublingual isosorbide dinitrate. Only 84 % of proximal and middle coronary segments were evaluable, but in those segments they were able to detect the presence of ≥50 % stenosis with a per-segment sensitivity of 83 %. The ability to detect a patient with ≥50 % stenosis (per-patient sensitivity), however, was 93 %, though with a specificity only of 42 %. The mean scanning time was 70 min.
A meta-analysis published in 2004 compared native vessel CMRA with conventional invasive coronary angiography and documented similar findings [6] (Table 11.3). On a per-patient basis, the specificity was low, resulting in a high false positive rate. The diagnostic accuracy was best in the left anterior descending artery (LAD), but similar to the left main and right coronary arteries. However, the sensitivity for detection of atherosclerosis in the circumflex artery was relatively limited. Other authors have postulated this could be due to the relatively small caliber of the circumflex vessel in many patients or, more likely, its posterior location which results in a lower signal to noise ratio [5].
Table 11.3
Summary of diagnostic accuracy of CMRA against conventional X-ray angiography in evaluable segments, vessels, and patients
Analysis
Studies (n)
Weighted sensitivity RE (95 % CI)
Weighted specificity RE (95 % CI)
Segment level
27 (4,620)
73 % (69–77 %)a
86 % (80–90 %)a
Left mainb
19 (802)
69 % (56–79 %)
91 % (84–95 %)a
LAD
21 (1,058)
79 % (73–84 %)a
81 % (71–88 %)a
LCx
21 (674)
61 % (52–69 %)
85 % (78–90 %)a
RCA
21 (990)
71 % (64–78 %)a
84 % (77–88 %)a
Subject level
13 (607)
88 % (82–92 %)
56 % (43–68 %)a
Vessel level
11 (1,271)
75 % (68–80 %)a
85 % (78–90 %)a
In this same meta-analysis, a highlighted limitation was that only approximately 80 % of imaged segments were interpretable. In particular, distal coronary angiography with CMR was of limited value.
A more recent study using more contemporary technology and protocols was published in 2006. Sakuma et al. used a 1.5 tesla (T) MRI and a free breathing steady-state free precession sequence to show more favorable diagnostic accuracy in detecting patients with ≥50 % stenosis in arteries ≥2 mm [7]. Noteworthy also is the fact that images were not successfully acquired in 14 % of patients due to technical limitations (Fig. 11.11 and Table 11.4).
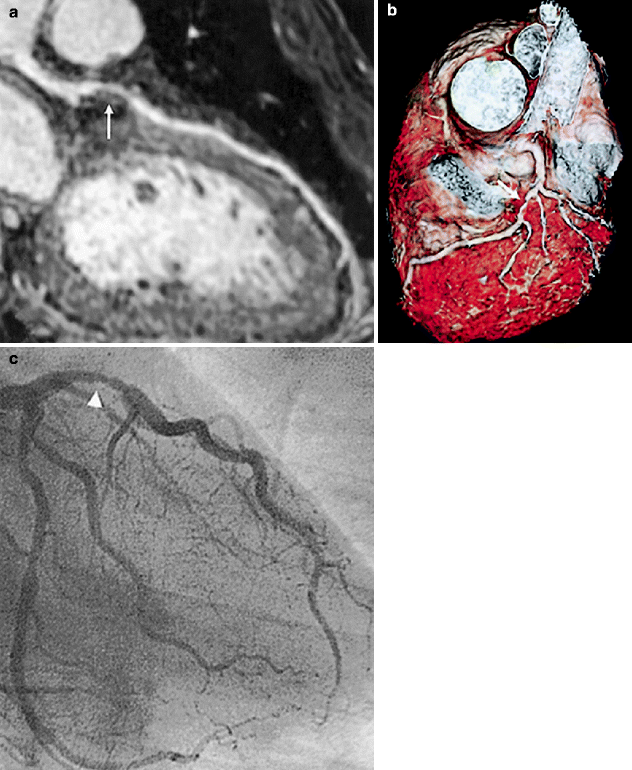
Fig. 11.11
(a–c) Visualization of a stenosis in the left anterior descending artery (LAD) with whole-heart coronary magnetic resonance angiography. (a) Curved multiplanar reconstruction image shows a stenosis in the LAD (white arrow). (b) Volume-rendering method demonstrates 3-dimensional view of the LAD with stenosis (white arrow). (c) X-ray coronary angiography reveals a stenosis of the proximal LAD (arrowhead) (Reproduced with permission of Elsevier from Sakuma et al. [7])
Table 11.4
Diagnostic accuracy of whole-heart coronary magnetic resonance angiography to detect stenoses of ≥50 % in 113 patients who completed acquisition of coronary magnetic resonance data
N
Sensitivity (%)
Specificity (%)
PPV (%)
NPV (%)
Accuracy (%)
Per patient
113
82 (69–91)
90 (79–96)
88 (74–95)
86 (75–93)
87 (79–92)
Per vessel
452
78 (66–86)
96 (93–97)
79 (67–87)
95 (93–97)
93 (90–95)
RCA
113
85 (65–96)
95 (88–98)
85 (65–95)
95 (88–98)
93 (86–97)
LM
113
NA
98 (93–100)
NA
100 (96–100)
98 (93–100)
LAD
113
77 (56–90)
95 (88–99)
83 (62–95)
93 (85–97)
91 (84–95)
LCX
113
70 (47–86)
93 (86–97)
73 (50–88)
92 (84–97)
89 (81–94)
Per segment
1,000
78 (68–85)
96 (95–97)
69 (60–77)
98 (96–98)
94 (93–96)
More recently, a meta-analysis comparing 989 patients (20 studies) using CMRA to 7,516 patients (89 studies) who underwent coronary CT angiography (CTA) reported that CMRA studies had gradually improved but still lagged behind coronary CT angiography in angiography accuracy [8]. Specifically, CMRA had a pooled sensitivity of 87 % (95 % CI, 83–90 %) and specificity of 70 % (95 % CI, 59–80 %), compared to sensitivity of 98 % (95 % CI, 97–99 %) and specificity of 89 % (95 % CI, 89–92 %) for >16-slice coronary CT angiography. The use of modern ≥64 slice and dual-source scanners for coronary CTA may have further widened the “accuracy-gap” between CT and MRI coronary angiography technologies, favoring CT.
CMR may be useful in patients with dense coronary calcification that can cause problems with beam hardening and blooming artifact with cardiac CT. Because coronary calcium contains a relative lack of the protons utilized for signaling in magnetic resonance imaging, it has been proposed that heavily calcified lesions may be more accurately assessed with MRI [9] (Fig. 11.12).
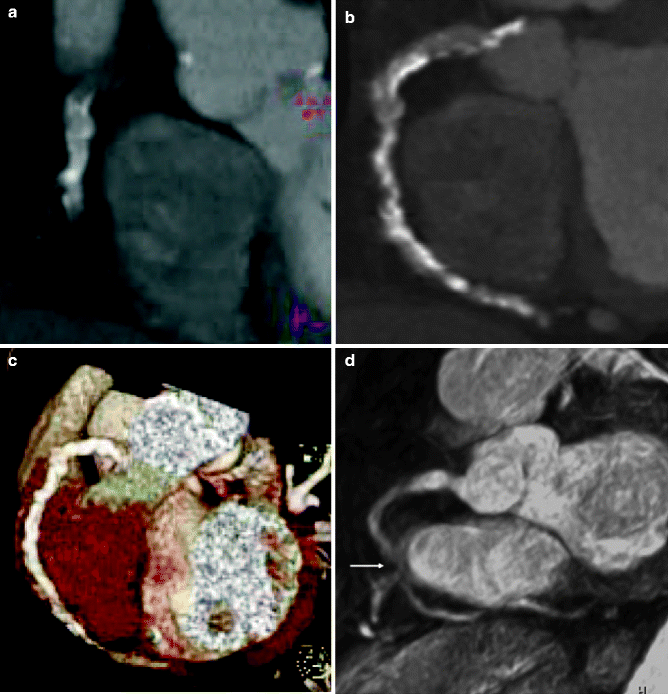
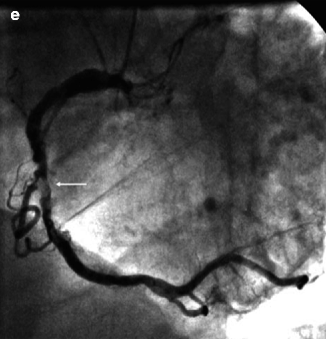
Fig. 11.12
(a–e) Contrast-enhanced, multi-detector CT angiography of the heart in the left anterior oblique view, which was unable to detect a stenotic lesion of the severely calcified right coronary artery. (a) Multiplanar reformatted view. (b) Maximum-intensity projection (3-mm slices). (c) Volume rendering. (d) Corresponding MRI-based coronary angiography (3-dimensional balanced turbo field echo) in the left anterior oblique view, demonstrating significant stenosis (arrow) of the mid right coronary artery. (e) Invasive coronary angiography confirmed the presence of an ulcerated, eccentric, calcified lesion (arrow) (Reproduced with permission from Langer et al. [40])
Compared with native coronary arteries, coronary artery bypass grafts are more static, are generally of larger caliber, and have a more linear course, making them better suited than native coronary arteries for assessment by CMRA. Overall, graft patency is reliably assessed using CMRA with sensitivities >90 % [10] (Fig. 11.13).
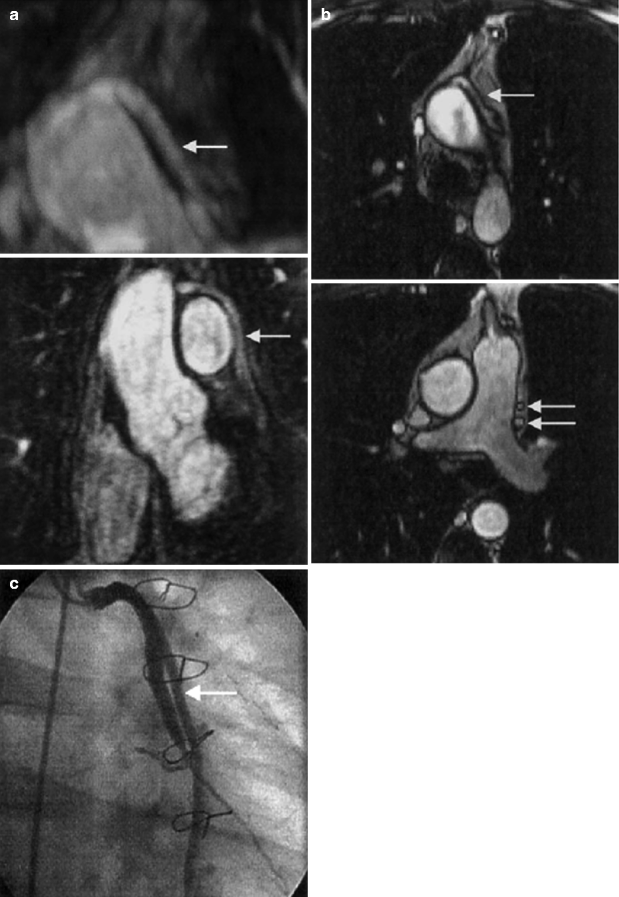
Fig. 11.13
(a) Top: Transverse three-dimensional rendered MR angiographic image shows a patent saphenous Y graft (arrow) to obtuse marginal vessels 1 and 2 of the circumflex artery. Bottom: Coronal maximum intensity projection confirms patent graft (arrow). Distal insertion is not demonstrated. (b) Top: shows corresponding patent saphenous Y graft (arrow). Bottom: Lower transverse true FISP angiographic image shows proximal segments of patent grafts (arrows). (c) Conventional invasive coronary angiogram confirms patent saphenous Y graft (arrow) to obtuse marginal vessels 1 and 2 of the circumflex artery (Reproduced with permission from Bunce et al. [41])
Quantification of graft stenosis has proved more difficult. In one more recent representative trial using 1.5 T MRI, 3D gradient echo imaging, and T2 prepulses to suppress fat and muscle, investigators demonstrated a sensitivity of roughly 73 % and a specificity of 80–87 % for detecting graft stenosis >70 % [11]. The same authors later published a paper illustrating that, beyond traditional angiography, cardiac MRI could be used to detect stenosis by noninvasively comparing peak velocities in the grafts before and after adenosine infusion [12]. Although both measurements could be obtained in only 80 % of vessels, the sensitivity and specificity for detecting vein graft stenosis ≥50 % was 94and 63 %, respectively and 96 and 92 % for stenosis ≥70 % (Fig. 11.14).
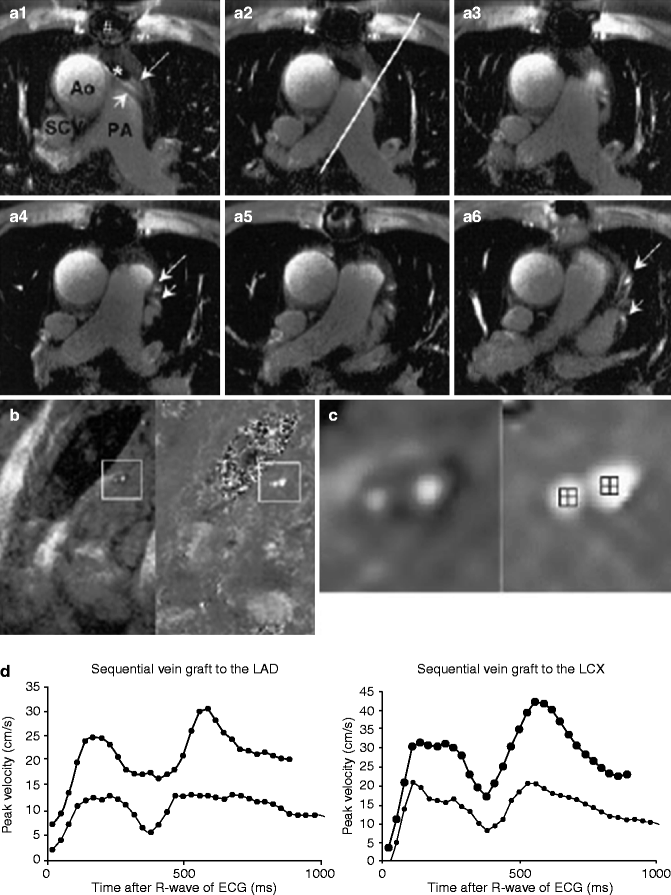
Fig. 11.14
(a) MRI in a patient with a sequential vein graft to the LCX region (small arrow) and a sequential vein graft to the LAD region (large arrow). A1 to A6 show the 2-dimensional gradient-echo scan. The line in A2 indicated the plane of the flow scan. (b) Shows the stress scan, which is enlarged in (c). The left images of (b, c) are modulus (anatomic) images and the right images are phase (functional) images. In the center of the phase images, the region of interest, which was used to determine peak velocity values, is depicted. The level of gray scale in phase images is directly correlated to velocity. The thin line in the graph reflects peak velocity versus time curve at baseline and the thick line during stress. Ao ascending aorta, PA pulmonary artery, SCV superior caval vein, # artifact from sterna wire, * artifact from stent (Reproduced with permission from Langerak et al. [12])
Like the metal from coronary stents, bypass markers or sternal wires are a potential source of artifact and may make graft evaluation difficult or even impossible (Fig. 11.15).
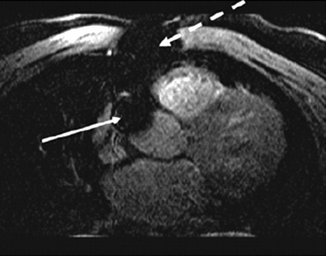
Fig. 11.15
Transverse coronary MRI in a patient with coronary artery bypass grafts. Note the large local artifacts (signal voids) related to the sternal wires (dashed arrow) and bypass graft markers (solid arrows) (Reproduced with permission from Manning et al. [3])
With limited data and technical limitations, CMRA is presently not well suited as a first line diagnostic test for high risk patients, including those with acute coronary syndromes. With a fair sensitivity and negative predictive value, it may be better suited to rule out surgical disease such as left main or three vessel coronary disease. The sensitivity and negative predictive value are particularly high for the identification of left main or multi-vessel disease [6].
Accuracy for Detecting Coronary Artery Disease: Stress Imaging and Perfusion
The routine application of CMRA in chest pain syndromes is not well established and is an area of ongoing research. However, other CMR techniques have been better validated in detecting coronary artery disease in symptomatic patients.
The mechanics of obtaining a cardiac MRI preclude the ability to use of treadmill exercise testing, so pharmacologic agents such as dobutamine, adenosine, or dipyramidole have traditionally been employed. Simple visual assessment of wall motion with and without these drugs can be performed to detect suspected coronary stenoses. Various MRI projections of the heart, similar to those used in echocardiography, can be used to analyze segmental wall motion abnormalities in more than one view (Fig. 11.16).
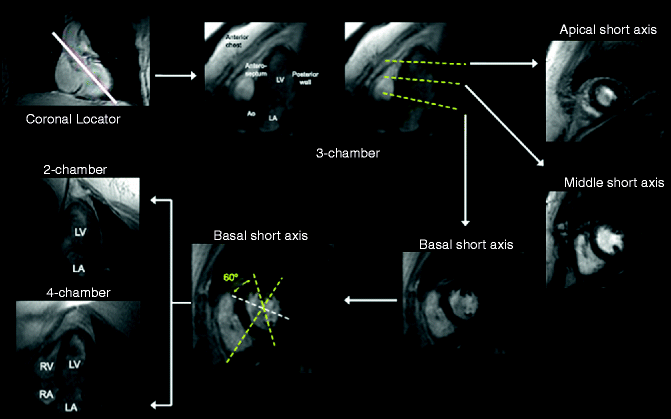
Fig. 11.16
Myocardial segmentation during dobutamine stress CMR. Strategy for obtaining three apical (3-chamber, 4-chamber, and 2-chamber) and three short-axis (basal, middle, and apical) cardiovascular MR views of the left ventricle. On each image the myocardium is gray and the blood pool white. The white solid line on the coronary locator, and the yellow dotted lines on the 3-chamber view and basal short-axis view indicate the slice positions for obtaining the subsequent views demarcated by the white arrows (Reproduced with permission from Charoenpanichkit and Hundley [42])
Invasive coronary angiography has confirmed that conventional wall motion assessment using gradient-echo cine images compares favorably with dobutamine stress echocardiography [13] (Table 11.5 and Fig. 11.17). Previous comparative studies have shown slightly higher sensitivity for detecting coronary stenosis with dobutamine, but better specificity with adenosine as the stress agent [14]. Dobutamine, however, can be time and labor intensive. A recent meta-analysis of stress perfusion cardiovascular MRI demonstrated a per-patient sensitivity of 89 % and a specificity of 80 %. Overall, adenosine based imaging performed slightly better than dipyridamole [15] (Table 11.6).
Table 11.5
Results of dobutamine stress echocardiography and dobutamine stress magnetic resonance compared with angiography
Stay updated, free articles. Join our Telegram channel

Full access? Get Clinical Tree


