Fig. 4.1
Limitations of areal bone mineral density. One of the limitations of areal bone mineral density is not presented bone structure. DXA scanner generates a 2D projection image of a bone with pixel values expressed in mineral area mass (g/cm2); however, strength of bone is governed by structural dimensions and tissue material properties, neither of which is directly measured in a conventional BMD measurement. BMC bone mineral content, BMD bone mineral density, DXA dual-energy X-ray absorptiometry
4.1.2 Technical Methods
Beck and Ruff have applied the HSA method to measure proximal femur geometry and strength using conventional DXA scans of the hip [9, 10]. The archived DXA images were analyzed using the HSA method which is described in detail in earlier publications [11]. Briefly, DXA scan files were first converted into bone mass images in which pixel values represent bone mass in grams per square centimeter, using an automated program. Structural analysis was then done in image files using a special interactive computer program. The underlying principle of the method is that a line of pixels traversing the bone axis is a projection of the corresponding cross section from which certain geometric properties can be derived.
The scan was performed using a commercially available hip positioner system (HPS; OsteoDyne, Durham, NC, USA) in order to ensure consistent positioning [12]. This device keeps the subject’s legs positioned in abduction and internal rotation (15°).
Three measured sites were defined as (1) narrow neck , traversing the narrowest width of the femoral neck; (2) intertrochanter , along the bisector of the shaft and femoral neck axes; and (3) shaft, at a distance of 1.5 times minimum neck width, distal to the intersection of the neck and shaft axes.
4.1.3 Structural Parameters
4.1.3.1 Areal BMD (g/cm2)
Areal BMD was measured using routine methods. Mean values of BMD from narrow neck region are on the average about 14 % higher than the conventional neck region of interest (ROI) values on the same subjects, although age trends are similar in previous reports [15].
4.1.3.2 Average Cortical Thickness (cm)
Average cortical thickness is an estimate of the mean cortical thickness assuming a circular (narrow neck or shaft) or elliptical (intertrochanter) annulus model of the cross section for use in the estimated buckling ratio. The model assumes that 60 %, 70 %, and 100 % of the measured bone mass is in the cortex for narrow neck, intertrochanter, and shaft, respectively. These methods have the possibility of overestimate of the cortical thickness in the cases having the increase of trabecular bone, especially in narrow neck and intertrochanter regions.
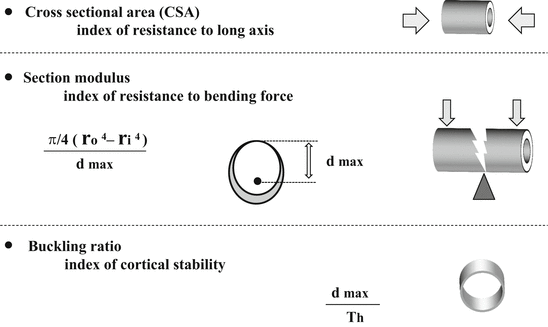
4.1.3.3 Cross-Sectional Area (CSA , cm2) (Fig. 4.2)

Fig. 4.2
Structural parameters in HSA
CSA is an index of resistance to forces directed along the long axis of the bone
Section modulus is an index of resistance to bending forces. Due to limitations of a 2D DXA image, section modulus is only relevant for bending in the plane of the DXA image
Buckling ratio is an index of cortical stability
HSA hip structure analysis, CSA cross-sectional area, DXA dual-energy X-ray absorptiometry, r o outer diameter, r i inner diameter, d max maximum distance from either bone edge to the centroid of the profile, Th average cortical thickness
4.1.3.4 Section Modulus (cm3) (Fig. 4.2)
This is an index of resistance to bending forces and is calculated as CSMI/d max where CSMI is the cross-sectional moment of inertia and d max is the maximum distance from either bone edge to the centroid of the profile [13, 14]. The CSMI is derived from the integral of the bone mass profile across the bone weighted by the square of distance from the center of mass. Due to limitations of a 2D DXA image, the CSMI and section modulus derived by HSA are only relevant for bending in the plane of the DXA image.
4.1.3.5 Buckling Ratio (Fig. 4.2)
Buckling ratio describes stable configurations of thin-walled tubes subjected to compressive loads and requires an estimate of the cortical thickness. The buckling ratio is computed as the ratio of d max to the estimated mean cortical thickness. Buckling ratio is mainly presented in narrow neck and intertrochanter region, because this parameter in the shaft is not important in meaning.
4.1.3.6 Other Parameters
In addition to these parameters, the HSA program measures neck-shaft angle and femoral neck length. The latter is defined as the distance from the center of the femoral head to the intersection of the neck and shaft axes.
4.1.4 Methodological Limitations
There are methodological limitations in HSA. DXA scanners are not designed or optimized to measure structural dimensions so that precision was relatively poor. In addition, it is difficult in reproducing the position of the 3D femur in 2D images separated months to years apart, although hip positioner systems are available in clinical use [12]. The use of 2D DXA scans means that the section modulus is assessed only in the scan plane; effects of treatment may be different for bending directions out of the image plane. The HSA method expresses the same data geometrically but assumes a constant tissue mineralization to do so and does not evaluate material strength effects.
The HSA method has these limitations; however, if technological improvements can make them reliable enough for clinical use, geometric measurements may ultimately provide a clearer view of the efficacy of treatment.
4.1.5 Correlations in Structural Parameters Between HSA and Quantitative Computed Tomography (QCT)
Khoo et al. reported the correlations between in structural parameters between HSA and QCT in 237 elderly females (77.6 ± 5.1, mean ± standard deviation) [18]. The correlations with coefficients were 0.45 for endosteal width, 0.46 for subperiosteal width, 0.73 for cross-sectional moment of inertia, 0.75 for buckling ratio, 0.77 for section modulus, 0.85 for averaged cortical thickness, 0.86 for BMD, and 0.90 for cross-sectional area with P values for regression being <0.001 in all parameters (Table 4.1). The correlations in endosteal width and subperiosteal width were lower, because of the relatively small range of values. On the other hand, the strength index, section modulus, CSA, and buckling ratio showed strong correlations between HSA and QCT.
Table 4.1
Correlations in structural parameters between HSA and QCT
Parameters | R |
|---|---|
Areal BMD | 0.86 |
CSA | 0.90 |
Cross-sectional moment of inertia | 0.73 |
Section modulus | 0.77 |
Averaged cortical thickness | 0.85 |
Endosteal width | 0.45 |
Subperiosteal width | 0.46 |
Buckling ratio | 0.75 |
These results demonstrated that the assumptions underlying the HSA approach using 2D data derived from DXA have been substantiated by true 3D images obtained by QCT; however, geometrical variables dependent on mass calibration standards, location of neck ROI, and mathematical derivation techniques are different.
4.2 Structural Trends in Aging
4.2.1 Aging Trends in Japanese Women (Fig. 4.3)

Fig. 4.3
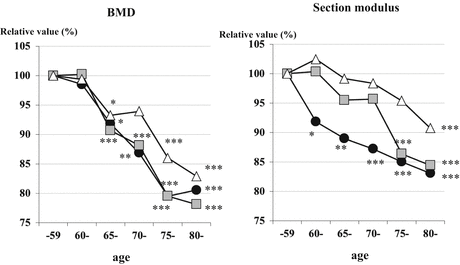
Aging trends in Japanese women. The trends in aging into the proximal femur geometry in Japanese women were analyzed using a cross-sectional sample obtained from a clinical sample. Areal bone mineral density (BMD) in each femur site appears to decline in the same trends; however, section moduli are quite discordant with those in areal BMD. Δ shaft,  intertrochanter, ● narrow neck. *p < 0.05, **p < 0.01, ***p < 0.001 vs standard reference (50–59 years of age) (Reference [17])
 intertrochanter, ● narrow neck. *p < 0.05, **p < 0.01, ***p < 0.001 vs standard reference (50–59 years of age) (Reference [17])
Areal BMD in each femur site appears to decline in the same trends. BMD at narrow neck, intertrochanter, and shaft in the oldest group (80+ years) decreased by 19.5 %, 21.8 %, and 17.1 % compared to the standard value, respectively (Fig. 4.3). Measured on the same subjects, section modulus are quite discordant with those in areal BMD. Section modulus at narrow neck decreased age-dependent manner; the oldest group (80+ years) averages 17.0 % less than standard value. In contrast, section modulus at intertrochanter and shaft appears to decline more slowly before 75 years of age; after that, it significantly decreased by 15.6 % in the oldest group (80+ years) at intertrochanter. There are no significant differences between narrow neck and intertrochanter in the group of 75–79 years and 80+ years. On the other hand, section modulus at shaft appears to remain static by 95.4 % until 70–74 years of age and 90.8 % in the group of 80+ years. This was also true in the rate of expansion of subperiosteal diameter which partially explains the reduction in areal BMD and that provides a mechanical explanation for why the apparent decline in section modulus is smaller than the change in BMD.
HSA in Japanese women showed that reduction in geometric strength as reflected by the section modulus was not dependent on decline in BMD. The section modulus is mainly influenced by changes in cortical dimensions. Mathematically, the section modulus is more strongly dependent on subperiosteal diameter than endocortical diameter, so that a greater bone loss at the endocortical surface can be compensated by a smaller increase in subperiosteal diameter. Subperiosteal expansion with age is thought to be a response to bone resorption in the endocortical surface for maintaining bone strength [19]. Indeed, subperiosteal diameters were positively correlated with age at all three regions in this study. Although cortices become progressively thinner through life, geometric strength at the femoral shaft is maintained.
Iki et al. showed the geographical differences in HSA parameters in four areas in Japan [20]. The areal differences were within the range of 10 % between the lowest area (Sanuki) and the highest area (Memuro) with an inverse association in buckling ratio.
4.2.2 The Epidemiology of Hip Fracture and Structural Trends in Japan
The committee for osteoporosis treatment of the Japanese Orthopaedic Association had elucidated the current status of hip fracture incidence in Japan [21]. The number of patients with femoral neck fractures gradually increased with age from 60 to 75 years, and exceeded that with trochanteric fractures before 75 years. In contrast, the number of patients with intertrochanter fracture rapidly increases after 75 years of age, and these figures became inverted thereafter.
The results in a cross-sectional sample of Japanese women show that although BMD declines with age in all regions, the section modulus appears to decline at a slower rate than that of BMD. The changing pattern in the section modulus at narrow neck and intertrochanter in Japan might be consistent with the epidemiological evidence of hip fracture (neck and trochanteric fracture) rates in Japan (Fig. 4.3).
4.2.3 Racial and Gender Differences
The previous reports have investigated gender differences in femoral neck geometry in an aging population and differences in pre- and postmenopausal hip geometry in white and black women [10, 15, 22, 23]. Note that there are some apparent differences in age trends between Japanese and US white women. Rates of bone loss (CSA decline) are actually greater in Japanese while rates of neck expansion (outer diameter) appear to be greater in US whites. The age trend in bending resistance is actually greater in Japanese women while the apparent increase in buckling ratio (toward greater instability) is greater in white women. These differences are reflected in geometric properties like the bone CSA and section modulus which define resistance to axial and bending loads, respectively.
Beck et al. analyzed structural parameters in non-Hispanic white men and women acquired in the Third National Health and Nutrition Examination Survey (NHANES III) [15]. The BMD decline with age in the narrow neck and shaft was similar to that in conventional regions. On the other hand, the section modulus at both the narrow neck and the shaft regions remains nearly constant until the fifth decade in females and then declined at a slower rate than BMD. In males, the narrow neck section modulus declined modestly until the fifth decade and then remained nearly constant whereas the shaft section modulus was static until the fifth decade and then increased steadily. The aging loss of BMD in the hip does not necessarily mean reduced mechanical strength.
Wang et al. measured the structural basis of racial and sex differences in femoral neck fragility in 829 healthy Chinese and 1181 healthy Caucasian subjects aged 18-93 years. For both races, women had a higher fracture risk in bending than men [22].
4.3 Relations Between Bone Biological Makers and Structural Parameters
Takada et al. had clarified the correlations between biochemical marker of bone resorption and structural geometry of the proximal femur in postmenopausal women with osteoporosis [24].
Forty-five postmenopausal women with osteoporosis were measured serum type I collagen cross-linked N-telopeptide (sNTX) as biochemical markers of bone resorption and HSA parameters. The median sNTX at baseline was 15.3 nmol bone collagen equivalent (BCE)/L (reference range for Japanese healthy premenopausal women, 7.5–16.5 nmol BCE/L) [25]. At baseline, sNTX correlated inversely with BMD, CSA, average cortical thickness, and section modulus and positively with buckling ratio in the intertrochanter and shaft (but not the narrow neck) (Table 4.2). These correlations were significant, both crude and adjusted for age. These data indicated that the surrogate markers for hip fracture, among sNTX, BMD and HSA parameters, showed significant correlations.
Table 4.2
Correlations (Peason’s R) between sNTX and HSA parameters
Narrow neck | Intertrochanter | Shaft | |
|---|---|---|---|
BMD (g/cm2) | 0.056 | −0.404** | −0.413** |
CSA (cm2) | 0.030 | −0.386** | −0.433** |
Inner diameter (cm) | −0.064 | 0.168 | 0.248 |
Average cortical thickness (cm) | 0.057 | −0.370* | −0.378* |
Section modulus (cm3) | −0.177 | −0.325* | −0.321* |
Buckling ratio | 0.036 | 0.504** | 0.390** |
The other bone metabolic markers, type 1 procollagen-N-propeptide (P1NP) and tartrate-resistant acid phosphatase 5b (TRACP-5b) , were also correlated inversely with BMD, CSA, average cortical thickness, and section modulus and positively with buckling ratio in narrow neck and intertrochanter in another study (Table 4.3) [26].
Table 4.3
Correlations (Peason’s R) between bone metabolic markers (TRACP-5b, P1NP) and HSA parameters
TRACP-5b (n = 201) | P1NP (n = 83) | |
|---|---|---|
Narrow neck | ||
BMD (g/cm2) | −0.253** | −0.406** |
CSA (cm2) | −0.232** | −0.323* |
Average cortical thickness (cm) | −0.250** | −0.394** |
Section modulus (cm3) | −0.090 | −0.179 |
Buckling ratio | 0.233** | 0.485** |
Intertrochanter | ||
BMD (g/cm2) | −0.296** | −0.369** |
CSA (cm2) | −0.260** | −0.338* |
Average cortical thickness (cm) | −0.254** | −0.357* |
Section modulus (cm3) | −0.190* | −0.290* |
Buckling ratio | 0.257** | 0.404** |
4.4 Relations Between Body Weight, Body Composition, and HSA Parameters
4.4.1 Body Weight
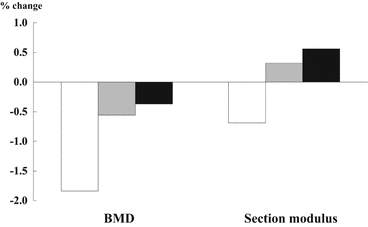
Longitudinal hip data in 4187 mostly white, elderly women were analyzed whether altered skeletal load should stimulate adaptive increases or decreases in hip geometry [27]. Subjects with increasing load (weight gain >5 % in 3.5 years) lost narrow neck BMD, but section modulus increased markedly. On the other hand, those with declining skeletal loads (weight lost >5 % in 3.5 years) showed the greatest loss of BMD and significant declines in section modulus (Fig. 4.4). These results indicated that mechanical homeostasis in the hip is evident in section modulus but not in BMD.


Fig. 4.4
Changes of body weight and structural parameters in narrow neck. Subjects with increasing load (weight gain >5 % in 3.5 years) lost bone mineral density (BMD), but gained section modulus. On the other hand, those with declining skeletal loads (weight lost >5 % in 3.5 years) showed the greatest loss of BMD and section modulus. □ weight losers, those who lost >5 % in 3.5 years;  static weight, those who changed weight within 5 %; ■ weight gainers, those who gained >5 % in 3.5 years (Reference [27])
 static weight, those who changed weight within 5 %; ■ weight gainers, those who gained >5 % in 3.5 years (Reference [27])
4.4.2 Body Composition (Bone Mineral Content (BMC), Lean Mass, Fat Mass)
Takada et al. had reported the first presentation for the relations between the body composition (BMC, lean, fat) and HSA parameters in Japanese women [28]. One hundred eighty-three community-dwelling Japanese women (65.6 years of age) who had a checkup for osteoporosis were measured body composition in lower leg and hip geometry parameters by whole-body scan DXA and HSA, respectively. BMC and lean mass at narrow neck and intertrochanter were positively correlated with BMD, CSA, and section modulus (r = 0.425−0.874), and BMC was inversely correlated with buckling ratio (r = −0.494, −0.572). On the other hand, fat mass did not show significant correlation with CSA and section modulus (Table 4.4).
Table 4.4
Correlations between HSA parameters and body composition (bone mineral content, lean mass, fat mass)
BMD (g/cm2) | CSA (cm2) | Section modulus (cm3) | Buckling ratio | ||
|---|---|---|---|---|---|
BMC | Narrow neck | r = 0.774* | r = 0.839* | r = 0.773* | r = −0.494* |
Intertrochanter | r = 0.836* | r = 0.874* | r = 0.840*
Stay updated, free articles. Join our Telegram channel
Full access? Get Clinical Tree
 Get Clinical Tree app for offline access

|


