Fig. 1.
Activity categories as function of HRmax (the maximal individual heart rate).
For beginners in sports – especially, older ones – it is established practice that they first build up their base performance in range RECOM and then after sufficient advance continue within BE1, since exceeding these levels could even be hazardous for such untrained people. In general, efficient sport training requires a certain, well-known mixture of these activities levels in Fig. 1. Else there won’t be any power advance or even physical deterioration may arise after reaching a certain endurance level despite continued high training efforts.
As sample reference, Fig. 1 exposes also some typical ranges for different running activities in the right column, while the left column in the table applies to human sports activities in general.
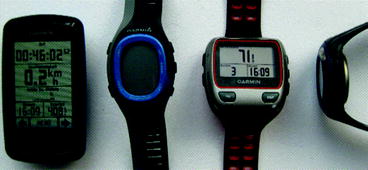
Electronic consumer market offers today a big variety of devices for HR monitoring (Fig. 2). This ranges from rather simple and cheap watches to elaborated sports computers. All of them are tiny, wearable devices, but their ergonomy in terms of user interfacing (UI) appears rather low, when considering fundamental knowledge and experience for the research field of human computer interaction (HCI). For instance, usually the actual heart rate count is printed in letters of limited size and often with limited contrast on B+W displays. This invokes two fundamental problems, since this kind of output is
Certainly, people usually claim that they can easily remember the desired limits for their workout in terms of lower and upper heart rate count. In training practice, after longer time of demanding activities, the true experience is quite different: even the comparison of the simple numbers will get really slow and causes considerable extra efforts, after, for instance, attending several hours in a distance run.
readable at a low speed only
must be categorized by the training persons themselves (refer to Fig. 1)
Fig. 2.
Typical sports computers and watches, which can perform heart rate monitoring as main feature or in addition to other functionalities.
Another effect is, that the measuring results from the heart sensor are sometimes disturbed for spurious reasons, and displayed totally unfiltered by the sports watches. In general, systematic errors in the sensor information have been reported recently for such sports devices [5].
The actual trend of the HR – in particular the question, whether the heart is getting slowly too high or too low – is particularly relevant for efficiently controlling an on-going workout. Despite this interrelation, the HR trend has to be traced manually by the sports user, while observing HR number display of the sports computer and calculating then the slope “by hand”.
There are also already modern UI concepts implemented in some commercial devices. For instance, certain sports computers allow to program limits for a monitoring of the lower and upper HR during the workouts, and there is even a haptic warning signal generated, since these devices start vibrating, if one of these limits is exceeded.
In daily use, it unfortunately turns out that exactly this feature is worthless, because the unfiltered HR measures spuriously produce such warning signals. Furthermore, the warning signal in the sports watch is often identically for the events of too low and too high values. This makes it impossible to interpret the haptic notification correctly. Further reading of a message is required that is then displayed in even smaller letters, since the corresponding printout carries more information and requires more characters that have to map on the tiny screen.
From fundamental HCI research it can be derived, that information perception in computerized displays can be accelerated by different principles:
As standard knowledge from the use of technical systems it is suggested that analogue tachometers are read approx. three times faster than digitally displayed ones. Although investigations from the modern application field of automotive do not proof this number as precise value [7], they do support the general theory that analogue displays are perceived at least as fast, by tendency even faster than digital ones.
Using color as information indicator [6]
Using analogue graphics instead of values that are in printed in letters
As complementing UI aspect, the benefit of coloring texts is well know and has been investigated thoroughly during the time, when colored computer displays became affordable and were widely commercialized. Systematic research has shown that the use of colors increases the finding speed for a certain passage on a screen [8]. The best scheme was found to use colors that are as distinct as possible for enabling the fastest perception of different information contents [9].
For the user’s convenience, the categorization and the detection of out-of-band-trends could be easily performed by the sports computers and data filtering could prevent the display of erroneous or misguiding outputs. The calculated results and trends, and especially the commands, whether the training should be more challenging or slower for mapping the desired working range, can be indicated to the user in a more easily readable manner than just exposing the plain digits of the current heart rate. Graphical symbols and/or coloring can be used for this purpose instead of text printouts.
In the following sections, the considerations and deductions are discussed that guided to the design and construction of an appropriate heart rate monitor that is intended for sports and health exercises. First scope was an improved UI that meets standards according to the established knowledge from the field of HCI. Second focus was a general improvement of signal processing, which is described in the next section, as it depicts the base for the whole UI concept.
A relevant part of the improvement is also that the person, who uses this device, is not required to know all the numbers and relations of sports training categories, but simple button presses inside the application allow defining the proper and desired demand level of the workout. Accordingly, the system is even more valuable for beginners and in sports endurance trainings.
2 Signal Conditioning of Heart Rate Data
2.1 Low-Pass Filtering of Input Stream
For the detection of heart activities, the use of special chest straps has been established and commercialized. Such products work really reliable also for long time of continuous use. Commonly, the signals are recorded from two skin electrodes across the lower chest, and are then processed by a tiny hardware module on the belt that transmits the result via RF to any data processing sink.
In the experiments here, a comfort chest strap of the manufacturer Garmin Ltd. was used, its RF transmission is composed in accordance to the ANT+ standard [10] that is discussed in the following section about technical aspects.
The used sensor produces four raw measures per second, a sampling rate that is typical for such chest straps. The observation is that sometime these HR measures appear spuriously distorted, the reasons have not scientifically been investigated yet, but are suspected being manifold, e.g., the electrode contacts are not always accurate due to body movements, electronic problems, and RF disturbances.
The dedicate reasons may vary, of importance is mainly, how further processing can overcome such effects of falsified input data. A standard solution in signal processing is averaging consecutive measures as this stands for filtering the effect of such unavoidable and unpredictable short-term disturbances. The properties of such a low-pass filter have to be aligned to the physiological behavior of the human body in general, since averaging in terms of any low-pass filtering will suppress the slope of the output signal and may therefore lead to wrong macroscopic measures, which would automatically consequence wrong instructions for any on-going training activities.
Medical research is much older than mobile computer technology, and hence, base investigations about the slope of the HR under certain influencing conditions can be found already from the last century [11]. In this extreme, but indicative experiment, stopping breath followed by physical effort showed already that the body reaction in terms of increasing heart beat rate after sudden load events may be delayed in the order of seconds.
This easily can also be verified with modern computer technology like in the practical experiment in Fig. 3 (an engineering version of the HR monitor was used in this test). From both sources, it can be deducted that averaging HR samples within a range of few seconds will still yield sufficient results with adequate slope. Hence, a time slot of 2.5 s, which stands for an averaging frame of ten incoming sensor measures, is applied in the software construction here. A sliding time-window is used, so the averaging stage yields also an output rate of four values per second, which is synchronized to the input data stream.
Fig. 3.
Experiment on the slope of the heart rate. After slight warming up, three pull-ups are completed while holding breath during the plotted activity window (rectangular curve). The heart rate responds by a gradual increase with delay, while the relaxation phase follows at an even slower remission speed.
2.2 Feature Extraction
Figure 4 shows the processing chain of the direct sensoring results as it is used as tier for four output information streams, which are to be exposed to the sports user (the corresponding particular UI methods are discussed in the next section in detail).
Fig. 4.
Generation and consumption model of the direct and deducted HR measures.
In accordance to the different output indicators, the HR has to be compared to thresholds. For instance, if a 60 years old person wants to perform exercises at the effort level of BE1, the heart rate should typically remain within the band from 119 to 136 beats per second. This mapping yields one important control information.
Of further relevance is the current trend in an on-going activity, more precisely the observation, whether there is a trend that the exercises are running out of the desired band. Such an evolvement can be detected by differentiating the averaged HR curve. The derived slope indicates, whether the pulse is getting too low or too high.
In workout practice, there will often be a slope that is non-zero, but the relevant matter is, whether the value is going to truly run out of band. With human as part of a control loop, correction indicators have to be applied carefully; else over-reaction easily may produce an undesired oscillation in the system. In general it is difficult to set a precise level of physical effort, although the body control can improve with growing experience.
Hence, for out-of-band trends it makes sense to have two stages of indication: first level is just exposing the current situation (applied when there is only slight decrease or increase) without any further instruction. The second is to more clearly indicate the wrong evolvement and combine it with a particular instruction for the activity like asking to slow down or speed up.
For the technically and medically interested user the unfiltered heart rate measure may also be of relevance, and accordingly the value is printed as digital number on the screen. This corresponds additionally to the fact that the heart rate value is the main information, which is commonly exposed in commercial HR monitors or HR apps for sports tracking. In summary, this analysis of data processing yields four output information streams for a display to the user: the raw data sequence and three filtered and processed derivatives of it.
3 Optimization of the User Interface
3.1 Visualization of Outputs
The primary goal of the user interface is to provide an information display that is as clear and as quick and effortless readable as possible. This display shall expose the situation and provide instructions of how to behave for staying within or – in case there is a mismatch already – for getting back to the desired training stress level.
As known from many other applications like, e.g., car driving and weather stations, an analogue tachometer is used as main display for the actual heart rate (Fig. 5). The phase vector inside the tachometer circle is controlled by the averaged HR, the corresponding indexing hand is drawn intentionally big for achieving high and quick readability. The indexing hand is painted in color.
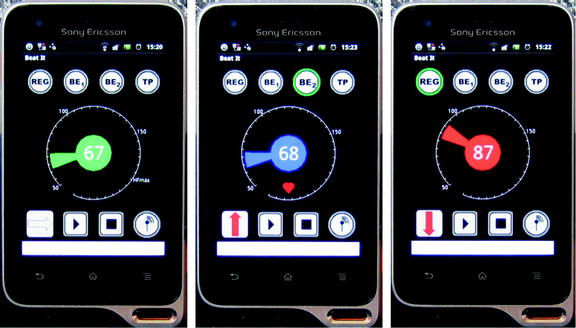
Fig. 5.
Collection of photographs of output screens for different use situations. As seen here, the UI is constructed in a self-explaining way. For testing of the output color scheme, the MHR was set to a non-physiological value of 100 bpm for the right two test images (Colour figure online).
By that, the information, which is to be controlled most often for an efficient workout, is visualized: bright green exposes that the heart rate is within the desired stress level band. If the HR drops too much, this color turns to blue, if it is getting too high, it turns to red. In this color indicator, the rule of readability was infringed intentionally: there are not only the three, very distinct colors of green, blue, and red in the scheme, but the transition between these color states is smoothed.
Like explained before, the human is a critical factor in the control loop, because over-reaction could arise easily by wrong reading or interpretation of displays: it doesn’t make sense to suddenly turn the display indicator for the non-mapping heart rate from bright green to bright red, if the range is just missed by one single or a few counts, because this certainly would provoke too strong corrections.
Related posts:
 for Sharing Good Practices in Sport Management
 of Mobile Technologies in the Preparations for Long Distance Running
 of the Environment on the Sport Performance: Computer Supported Training – A Case Study for Cycling Sports
 Peloton Dynamics in Competitive Cycling: A Quantitative Approach
Stay updated, free articles. Join our Telegram channel

Full access? Get Clinical Tree


