Study Design, Measurement, and Basic Statistical Analysis
Emory University School of Medicine, Atlanta, GA, USA
Introduction
Clinical, basic science and translational research studies contribute to an improved understanding of rheumatic diseases and disorders. Ongoing studies can lead to advancement of treatment and better outcomes for our patients. Therefore, a basic knowledge of study design, measurement, and statistical analysis is essential.
Epidemiologic Study Designs
Study design is a plan for selecting study subjects and obtaining data about them. Each design is devised to help answer a different type of study question:
- Observational studies
- Case control studies
- Individuals with disease (cases) are compared to individuals without disease (controls) retrospectively
- Compares frequency of past exposure between cases who develop disease and controls who do not have disease
- Data determining prior exposure to an agent are obtained
- The investigator works retrospectively
- Can calculate odds ratio
- Individuals with disease (cases) are compared to individuals without disease (controls) retrospectively
- Cross-sectional
- A population is observed at one point in time
- Exposure and outcome are determined at the same point or period in time
- All measurements are made on a single occasion to determine prevalence of a disease
- Can calculate prevalence
- All measurements are made on a single occasion to determine prevalence of a disease
- A population is observed at one point in time
- Cohort studies
- Individuals without disease are monitored prospectively for the development of disease
- Compares disease incidence over time between groups who have been exposed to a factor of interest
- Can be retrospective and prospective
- Individuals without disease are monitored prospectively for the development of disease
- Case control studies
- Clinical trials
- Phase 1 – human pharmacology trials to establish initial safety and tolerability of dose range, to assess pharmacodynamics, and to assess drug activity
- Phase 2 – performed to establish efficacy in the intended patient population
- Phase 3 – confirm therapeutic benefit
- Phase 4 – conducted after drug reaches the market to expand on knowledge of the drug’s safety, efficacy, and dose
- Phase 1 – human pharmacology trials to establish initial safety and tolerability of dose range, to assess pharmacodynamics, and to assess drug activity
Common Descriptors of Data
- Scales of measurement (Table 12.1)
- Categorical (nominal) variables
- Variables that are not quantifiable can be measured by classifying into categories
- Categories are not ordered
- Qualitative variables that can be categorized into proportions or percentages
- Examples: yes and no (dichotomous), blood type, gender
- Variables that are not quantifiable can be measured by classifying into categories
- Ordinal (ranked) variables
- Variables that have an order
- Although there is order among the categories, the difference between adjacent categories may not be uniform or quantifiable
- Examples: severity scores of pain (none, mild, moderate, severe)
- Variables that have an order
- Continuous (interval/numerical) variables
- Quantified intervals on an infinite scale of values
- Values are ranked
- Differences between numbers have meaning on a numerical scale
- Examples: age and blood pressure
- Quantified intervals on an infinite scale of values
- Categorical (nominal) variables
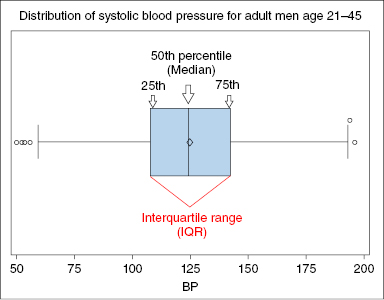
- Measures of central tendency – provides data on where data cluster (Figure 12.1)
- Mean – arithmetic average (continuous) or sum of the values divided by the number of values
- Median – centermost value (ranked or ordered categories)
- Mode – most frequently observed value (nominal data)
- Mean – arithmetic average (continuous) or sum of the values divided by the number of values
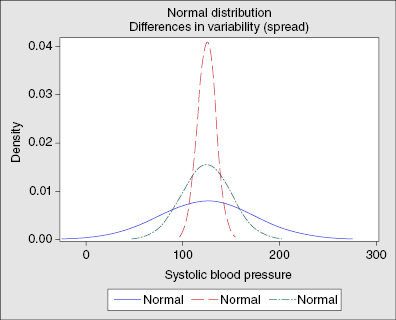
- Measures of spread or variation
- Standard deviation – the variability of individual observations or the measure of the spread of the variables (Figure 12.2)
- Standard error of the mean – the variability of means or the range of where the true population mean lies
- Confidence interval – an interval of values within which one is 95% confident that the true population parameter lies. One would expect that 95% of samples drawn from the population would have a sample estimate that fell within the designated confidence limits
- Standard deviation – the variability of individual observations or the measure of the spread of the variables (Figure 12.2)
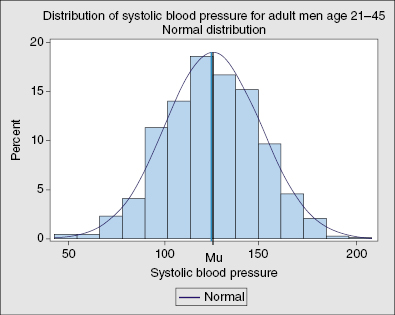
- Bell-shaped curve
- Normal or Gaussian distribution is a symmetric bell-shaped curve where the mean lies at the central peak, 50% of the distribution lies to the left of the mean, and 50% to the right of the mean (Figures 12.2, 12.3, 12.4)
| Scale | Description | Example |
|---|


