Although it is obvious that people exerting full effort on a test score higher than people making less effort, it is not obvious to what degree poor effort affects neuropsychological test scores. Nor is it self-evident how well scores on an effort test based on memory predict scores on non-memory tests. In this study, effort was measured in 1307 consecutive outpatients using the Word Memory Test (WMT). The mean WMT effort scores were divided into six ranges, from satisfactory (91% to 100% correct) to very low (50% correct or less). The tables show the mean scores on many commonly used neuropsychological tests for each range of effort on the WMT. As effort decreases, scores on most tests decrease significantly and systematically. In this sample, the variable of effort had more impact on test scores than severe traumatic brain injury.
Although it is intuitively obvious that people exerting a full effort on a test will score higher than people making less effort, it is not obvious to what degree poor effort will affect neuropsychological test scores. Nor is it self-evident how well scores on an effort test based on memory will predict scores on non-memory tests. In this study, effort was measured in 1307 consecutive outpatients using the Word Memory Test (WMT) . The mean WMT effort scores were divided into six ranges, from satisfactory (91% to 100% correct) to very low (50% correct or less). The tables show the mean scores on many commonly used neuropsychological tests for each range of effort on the WMT. As effort decreases, scores on most neuropsychological tests decrease significantly and systematically. In this sample, the variable of effort had more impact on test scores than severe traumatic brain injury.
Reitan has described a neuropsychological test as one whose scores are differentially affected by brain disease, rather than environmental factors. In a study of people who had brain injuries, it was found that the greater the severity of traumatic brain injury, based on time to follow commands, the lower were the Halstead-Reitan battery test scores . These findings were replicated by Rohling and colleagues , using a different test battery, confirming the differential sensitivity of neuropsychological tests to various levels of brain injury severity. Neuropsychological test scores, however, are also affected by environmental variables, one of which is the presence of incentives to perform well or poorly on testing. A person capable of recalling 10 words from a list could, in principle, decide to recall only 4 words, thereby introducing major error into test results. It is an empirical question whether brain injuries influence neuropsychological test scores more than motivational factors or vice versa. Another question is whether only some neuropsychological tests are affected by effort, as suggested by Nies and Sweet , or whether varying effort is a general phenomenon affecting most or all such tests. To answer these questions, the effects of effort and brain injury on neuropsychological test scores must be quantified and compared with each other, using data from actual patients.
It has been reported that the suppression of test scores by poor effort can be greater than the effects of a severe traumatic brain injury in people claiming compensation. Green and colleagues converted 43 neuropsychological test scores to Z-scores relative to external norms in 904 outpatients. It was found that effort explained approximately 50% of the variance in the neuropsychological test scores, which was far more than that explained by brain injury severity, education, or age. The mean composite neuropsychological test score was 0.5 standard deviations below the normal mean in patients who had the most severe brain injuries and who passed the WMT effort subtests. Yet, in the patients who had the most minor head injuries who failed the WMT, the mean composite neuropsychological test score was 1.5 standard deviations below the normal mean. The same degree of suppression of test scores was observed in patients of all diagnostic groups who failed the WMT effort measures. Thus, the effects of effort on neuropsychological tests can overshadow the effects of severe traumatic brain injury, producing the misleading appearance of cognitive deficits in cases who showed poor effort, and potentially obscuring real group differences.
The acceptance of spurious deficits in neuropsychological test results as representing valid impairment can have serious implications. Theories of brain disease may be altered, depending on whether or not effort is measured. For many years, for example, it was thought that neuropsychological deficits were greater in some cases of psychogenic nonepileptic seizures (PNES) than in actual epileptic patients. The deficits in PNES were thought to be indicative of presumed but undemonstrated brain disease. Drane and colleagues recently discovered, however, that more than half of PNES patients failed effort testing with the WMT. In comparison, the WMT failure rate was very low in the patients who had intractable seizures and who were due for brain surgery. Fifty percent of the variance in neuropsychological test scores was explainable by fluctuating effort. The results suggested that, as a group, the PNES patients’ neuropsychological test data were invalid because of inadequate effort, such that they could not be used to infer the presence or severity of underlying brain disease. These results throw doubt upon the validity of test data from past studies of PNES patients, which did not measure effort.
In a recent study of cases of mild head injury with compensation claims, it was found that 47% of the variance in a summary score for the Halstead-Reitan battery (General Neuropsychological Deficit Scale—the GNDS) was explained by effort measured by the Test of Memory Malingering . Thus three separate studies have shown that effort explains approximately 50% of the variance in neuropsychological test batteries. In two of these samples, there were financial incentives for symptom exaggeration because they were involved in making compensation claims. In the PNES study, however, the assessments were conducted to determine if brain surgery was needed for epilepsy, although external incentives to appear impaired could not be ruled out and most were receiving disability payments.
Important decisions rest on neuropsychological test data and, therefore, it is of fundamental importance to understand further the extent to which test scores are affected by diminishing effort. The tables in this article provide information on neuropsychological test results from 1307 outpatients who were clinically assessed in the private practice of the author. In nearly all cases, there were financial incentives for disability, whether from medical disability insurance, Workers’ Compensation, or personal injury litigation. Scores from 23 neuropsychological tests are tabulated according to ranges of effort measured by the computerized WMT. The tables show how scores on tests of memory, problem solving, fluency, manual skills, attention, and many other abilities decrease systematically as effort declines.
Method
Participants
The sample of 1307 cases, all of whom were tested by the author, included the 904 patients from the previous study of Green and colleagues , as well as 403 additional consecutive cases. There were 668 patients who had head injuries, some who had less than one day of post-traumatic amnesia (n = 520), and others who had one day or more of post-traumatic amnesia (n = 148). All were tested at least 1 month after the injury. Eighty-six percent of cases were tested at least 4 months post-injury, the median being 15 months. There were 130 neurological patients suffering from a variety of brain disorders, including strokes, aneurysms, multiple sclerosis, tumor, epilepsy, herpes simplex encephalitis, Von Hippel-Lindau disease, hypoxic event, abscess, venous thrombosis, and dorsal midbrain hemorrhage. There were 126 patients who had major depression, 23 who had anxiety-based disorders, 13 who had bipolar disorder, and 10 who had other psychotic illnesses. Finally, testing included 86 patients who had orthopedic injuries, 34 who had chronic fatigue syndrome, 78 who had pain disorder or fibromyalgia, and 139 who had various other conditions, such as alcoholism or dementia. Excluded from the study were an additional 50 cases given only the oral WMT for various reasons, such as blindness.
Referrals for assessment were made by the Workers’ Compensation Board in 41% of cases, by insurance companies handling medical disability claims in 33% of cases, and by lawyers representing the plaintiff or the defense in personal injury claims in 18% of cases. In a further 8% of cases, there was no direct involvement with a financial claim, although, in principle, some might later be able to make claims. For example, a large employer referred 40 people (3% of all cases) who had questions about cognitive impairment and emotional status impacting work performance. In the latter group, the very few classified as disabled would go on to receive a medical disability pension, but most were highly motivated to carry on working. Some cases were privately referred for various reasons, such as evaluation of suspected dementia.
Neuropsychological tests
The 1307 consecutive cases were given tests of a comprehensive range of abilities, and the numbers of cases taking each test are noted in the tables. Most of the tests used will be very familiar to neuropsychologists, such as the California Verbal Learning Test and tests referenced in the norms manual of Heaton and colleagues , including the Wisconsin Card Sorting Test, Category Test, Trail Making Test A and B, Thurstone Word Fluency Test, Grooved Pegboard, Hand Dynamometer, Finger Tapping Test, and Finger Tip Number Writing test . Other tests included Warrington’s Recognition Memory Tests for Words and Faces , the Ruff Figural Fluency Test , Gorham’s Proverbs Test , Digit Span and Visual Memory Span subtests of the Wechsler Memory Scale-Revised , the Continuous Visual Memory Test , the Rey Complex Figure Test , Benton’s Judgment of Line Orientation Test, and Benton’s Visual Form Discrimination Test . Intelligence was measured with the Wechsler Adult Intelligence Scale-Revised or its close equivalent, the computerized Multidimensional Aptitude Battery . Some tests will be less familiar, such as the Story Recall Test , the Emotional Perception Test , and the Alberta Smell Test . The Story Recall Test involves immediate recall of five short stories ranging from 10 to 25 items in length, and recall of the stories after a half-hour delay. The Emotional Perception Test requires the person to judge the emotions in the tone of voice of 45 tape-recorded sentences, each said in one of five emotions. The Alberta Smell Test involves sniffing a scented felt marker while one nostril is closed and then selecting the name of the odor from one of eight written on a sheet (eg, orange, lemon, mint). The score is the number correct out of ten, and each nostril is tested separately. The latter test was found to be more sensitive to the effects of a severe traumatic brain injury than any of the conventional neuropsychological tests studied .
Effort testing
To measure both effort and verbal memory, all cases were given the computerized WMT as part of 1.5 days of clinical neuropsychological testing, conducted between 1996 and 2004. Cooperative clients often completed testing in only 1 day, but many were slow to perform. The first two out of six subtests of the WMT are the Immediate Recognition (IR) and Delayed Recognition (DR) subtests, in which words from a previously presented list must be identified, when presented individually with a non-list foil word. They are the primary effort subtests. A third measure is derived from the consistency of performance from the first to the second subtest.
The mean of the three WMT effort measures (IR, DR, and Consistency) was calculated for each person. The scores were broken down into six ranges, where 91% to 100% defines the top range. It may be noted that the mean score from healthy adults tested with the WMT in a study by Suhr and Gunstadt was 99.5% correct (SD = 1.6). In the study by Gorissen and colleagues , the healthy adult mean was 96% (SD = 3), which is similar to the healthy adult mean of 97.8% (SD = 3) listed in the WMT Windows program . Hence nearly all healthy adults would be expected to score in the range 91% to 100% correct on the WMT effort subtests. The mean for neurological patients in the Gorissen and colleagues study was 93% (SD = 10). Scores of 81% to 90% make up the second range, scores that may be described as “marginal or failing,” although 42% of these scores were above the conservative cutoffs recommended in the WMT test manual . Successively lower ranges of WMT effort scores were 71% to 80%, 61% to 70%, 51% to 60%, and 50% or below.
In the tables, scores on neuropsychological tests are presented for people scoring in each of six ranges on their mean WMT effort scores. Other effort tests employed included the Amsterdam Short Term Memory Test and Computerized Assessment of Response Bias .
Results
Every attempt was made to obtain optimal performance from patients, and they were all warned in advance that full effort was necessary to produce valid results. Nevertheless, in this sample of 1307 outpatients, 403 cases (31%) failed the WMT using the clinically recommended cutoffs (82.5% or lower on IR, DR, or Consistency). In those who failed the WMT, the mean WMT effort scores ranged from 88.3% to 36.6%, with a mean WMT effort score of 71% (SD = 13). In the 904 patients who passed the WMT, the mean effort score was 96.2% (SD = 3.5), which is almost identical to the value of 96% (SD = 3) found in healthy adults in the study of Gorissen and colleagues , using the Spanish and French translations of the WMT.
Simulator profile found in those failing the Word Memory Test
It is not plausible that the profiles produced by the WMT failures were valid (ie, that they were reliable test scores, reflecting good effort) because there were important internal inconsistencies between their scores on the WMT subtests, similar to those found in known simulators. The mean WMT scores of 25 patients who had early dementia tested by Brockhaus and Merten are contained within the WMT Windows program and are shown in Fig. 1 . On the very easy WMT subtests (IR and DR), the 403 WMT failures in the current study scored 74% (SD = 16) and 71% (SD = 16), whereas the latter dementia patients scored higher than that (85%, SD = 11, and 82%, SD = 15, respectively; see Fig. 1 ). If valid, this would mean that those who failed the WMT in the current study were more impaired than the dementia patients, which is not plausible considering the diagnoses and ages of these patients. For example, 176 of the WMT failures were cases of mild head injury, with a mean Glasgow Coma Scale (GCS) of 14.7 and a mean age of only 41 years.
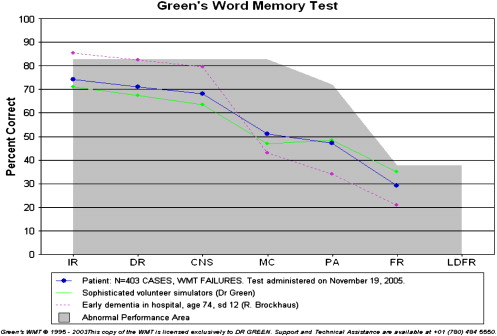
Also, even if we were to accept that they were making a valid effort but scoring lower than people who had dementia on the easy subtests, we would also expect the WMT failures to show more impairment than the dementia patients on the more difficult WMT subtests, but this was not the case. Just the opposite was found. Whereas they scored lower than dementia patients on the very easy WMT subtests, the WMT failures systematically scored higher than dementia patients on the most difficult WMT subtests (see Fig. 1 ). On the MC (multiple choice) subtest, for example, the WMT failures scored a mean of 51% (SD = 18), compared with 43% (SD = 20) in the dementia patients. On paired associate (PA) recall, the failures scored a mean of 47% (SD = 17), compared with 34% (SD = 15) in the dementia patients. On free recall (FR) of the word list, the failures scored a mean of 29% (SD = 13), compared with 21% (SD = 16) in the dementia patients.
Such a pattern of lower scores than dementia patients on extremely easy WMT subtests, but higher scores than dementia patients on harder WMT subtests is precisely the pattern observed in studies of simulators (ie, volunteers who were asked to fake memory impairment). For example, highly educated volunteers who were asked to simulate memory impairment scored means of only 71% and 67% correct on the WMT IR and DR subtests, and therefore they scored lower than dementia patients on the very easy subtests . Yet their mean scores on the harder subtests (MC = 47%, PA = 48% & FR = 35%) were all higher than those of the dementia patients discussed above (see Fig. 1 ). The marked similarity between the WMT profiles in those failing WMT effort tests clinically and those of known simulators suggests that those failing the WMT clinically were making a poor effort, if not actually trying to simulate memory impairment.
Neuropsychological test scores in Word Memory Test failures
Cases passing the WMT effort subtests were compared with cases failing the WMT in terms of their mean scores on each of the neuropsychological tests shown in Tables 1–21 . The differences were all strongly in the direction of poorer performances in those failing WMT. The differences were significant at .0001 in all comparisons using one-way analysis of variance (ANOVA), with the exception of Grooved Pegboard left hand ( P < .014), Finger Tip Number Writing left hand ( P <.006) and right hand ( P < .001), and one nonsignificant result on Ruff Figural Fluency perseverative responses ( P < .4). The pervasive influence of effort on almost all neuropsychological tests may be readily seen in the tables. The California Verbal Learning Test (CVLT) will be used below to illustrate how effort affects test scores.
| Mean WMT effort | N | CVLT SD, free recall mean | CVLT SD free SD | CVLT LD, free recall mean | CVLT LD free SD |
|---|---|---|---|---|---|
| 91%–100% | 745 | 10.7 | 3.2 | 11.2 | 3.2 |
| 81%–90% | 206 | 8.3 | 3.2 | 8.9 | 3.2 |
| 71%–80% | 105 | 7.8 | 3.5 | 8.2 | 3.4 |
| 61%–70% | 61 | 7.4 | 3.0 | 7.3 | 3.3 |
| 51%–60% | 50 | 5.8 | 2.9 | 5.5 | 3.1 |
| ≤50% | 34 | 4.4 | 2.5 | 3.3 | 3.0 |
| Mean WMT effort | N | CVLT SD free recall | CVLT SD cued recall | CVLT LD free recall | CVLT LD cued recall |
|---|---|---|---|---|---|
| 91%–100% | 745 | 11.8 | 2.8 | 11.9 | 2.9 |
| 81%–90% | 206 | 9.7 | 3.0 | 9.8 | 3.0 |
| 71%–80% | 105 | 9.5 | 3.4 | 9.2 | 3.2 |
| 61%–70% | 61 | 8.9 | 3.0 | 8.5 | 3.2 |
| 51%–60% | 50 | 7.0 | 3.0 | 6.5 | 3.2 |
| ≤50% | 34 | 5.4 | 3.1 | 4.5 | 3.1 |
| Mean WMT effort | N | CVLT trial 1 mean | CVLT trial 1 SD | CVLT trial 5 mean | CVLT trial 5 SD | CVLT rec hits mean | CVLT rec hits SD |
|---|---|---|---|---|---|---|---|
| 91%–100% | 745 | 7.4 | 2.3 | 12.4 | 2.5 | 14.6 | 1.6 |
| 81%–90% | 206 | 6.4 | 2.1 | 10.6 | 2.7 | 13.5 | 2.2 |
| 71%–80% | 105 | 6.0 | 2.2 | 10.2 | 3.1 | 12.8 | 2.9 |
| 61%–70% | 61 | 6.0 | 2.3 | 9.7 | 2.6 | 11.9 | 2.8 |
| 51%–60% | 50 | 4.9 | 1.6 | 8.7 | 2.8 | 10.7 | 3.2 |
| ≤50% | 34 | 4.5 | 2.1 | 7.0 | 2.9 | 7.6 | 3.7 |
| GCS | N | CVLT SD free recall mean | CVLT SD free recall SD | CVLT LD free recall mean | CVLT LD free recall SD |
|---|---|---|---|---|---|
| 3 | 11 | 9.1 | 3.1 | 10.3 | 3.2 |
| 5 | 7 | 8.0 | 2.4 | 7.6 | 3.1 |
| 6 | 8 | 7.9 | 3.3 | 8.3 | 2.1 |
| 7 | 9 | 8.5 | 4.1 | 9.6 | 5.5 |
| 8 | 6 | 8.5 | 3.1 | 9.3 | 2.8 |
| 9 | 5 | 10.7 | 3.9 | 11.0 | 2.9 |
| 10 | 6 | 11.4 | 3.1 | 11.6 | 3.2 |
| 11 | 8 | 10.6 | 3.5 | 11.6 | 3.4 |
| 12 | 7 | 10.1 | 2.7 | 10.7 | 2.2 |
| 13 | 9 | 11.2 | 3.2 | 11.6 | 3.4 |
| 14 | 39 | 10.6 | 3.2 | 11.3 | 2.9 |
| 15 | 152 | 10.2 | 3.2 | 10.7 | 3.2 |
| Mean WMT effort | N | CVLT SD FREE mean | CVLT SD FREE SD | CVLT LD FREE mean | CVLT LD FREE SD | CVLT rec hits mean | CVLT rec hits SD | TOMM trial 2 mean | TOMM trial 2 SD |
|---|---|---|---|---|---|---|---|---|---|
| 91%–100% | 365 | 11.0 | 3.0 | 11.4 | 3.1 | 14.8 | 1.6 | 49.8 | .9 |
| 81%–90% | 128 | 8.8 | 3.4 | 9.2 | 3.2 | 14.0 | 2.0 | 49.0 | 2.5 |
| 71%–80% | 58 | 8.9 | 3.4 | 8.7 | 3.7 | 13.5 | 2.3 | 46.5 | 4.9 |
| 61%–70% | 46 | 6.6 | 2.8 | 6.6 | 2.8 | 11.5 | 3.7 | 43.7 | 8.0 |
| 51%–60% | 23 | 6.6 | 2.4 | 6.3 | 2.9 | 11.6 | 3.0 | 38.8 | 9.4 |
| ≤50% | 13 | 3.8 | 2.5 | 3.5 | 2.7 | 9.2 | 4.4 | 28.9 | 10.9 |
| Mean WMT effort | N | WRMT faces mean | WRMT faces SD | N | WRMT words mean | WRMT words SD |
|---|---|---|---|---|---|---|
| 91%–100% | 645 | 41.8 | 5.1 | 301 | 46.0 | 4.3 |
| 81%–90% | 176 | 39.8 | 5.8 | 76 | 41.7 | 5.7 |
| 71%–80% | 85 | 37.1 | 6.6 | 35 | 39.8 | 6.7 |
| 61%–70% | 51 | 36.2 | 6.5 | 25 | 36.1 | 7.3 |
| 51%–60% | 37 | 32.3 | 8.1 | 13 | 29.1 | 6.9 |
| ≤50% | 31 | 26.1 | 8.8 | 15 | 23.0 | 5.4 |
| Mean WMT effort | N | Immediate story recall mean | Immediate story recall SD | N | Delayed recall mean | Delayed recall SD |
|---|---|---|---|---|---|---|
| 91%–100% | 773 | 47.1 | 9.5 | 766 | 36.3 | 12.2 |
| 81%–90% | 207 | 42.3 | 9.4 | 203 | 27.0 | 11.7 |
| 71%–80% | 105 | 40.9 | 10.3 | 104 | 26.9 | 12.3 |
| 61%–70% | 58 | 38.6 | 8.9 | 57 | 23.5 | 9.9 |
| 51%–60% | 45 | 34.8 | 11.6 | 45 | 17.8 | 10.7 |
| ≤50% | 31 | 28.5 | 10.6 | 31 | 13.8 | 8.8 |
| Mean WMT effort | N | Rey CFT immediate recall (%ile) mean | Rey CFT immediate recall SD | Rey CFT delayed recall (percentile) mean | Rey CFT delayed recall SD | Rey CFT copy (raw) mean | Rey CFT copy SD |
|---|---|---|---|---|---|---|---|
| 91%–100% | 813 | 37.7 | 30.6 | 35.9 | 31.1 | 33.1 | 3.0 |
| 81%–90% | 218 | 26.4 | 28.2 | 23.3 | 26.4 | 32.1 | 3.4 |
| 71%–80% | 119 | 22.6 | 23.8 | 20.5 | 25.2 | 31.4 | 4.7 |
| 61%–70% | 63 | 14.3 | 18.5 | 12.4 | 16.6 | 30.5 | 4.1 |
| 51%–60% | 55 | 10.9 | 14.9 | 10.4 | 15.0 | 27.5 | 6.5 |
| 41.1% | 39 | 9.5 | 16.7 | 5.4 | 9.4 | 27.0 | 5.8 |
| Mean WMT effort | N | Trail Making A (seconds) mean | Trail Making A SD | Trail Making B (seconds) mean | Trail Making B SD |
|---|---|---|---|---|---|
| 91%–100% | 813 | 30.4 | 12.6 | 76.5 | 48.1 |
| 81%–90% | 218 | 38.6 | 17.3 | 105.0 | 77.0 |
| 71%–80% | 119 | 42.1 | 20.2 | 112.7 | 78.5 |
| 61%–70% | 63 | 44.9 | 24.9 | 139.7 | 96.9 |
| 51%–60% | 55 | 60.3 | 46.1 | 183.1 | 157.5 |
| ≤50% | 39 | 65.2 | 45.1 | 159.6 | 141.1 |
| Mean WMT effort | N | PIQ mean | PIQ SD | VIQ mean | VIQ SD |
|---|---|---|---|---|---|
| 91%–100% | 761 | 104.7 | 12.9 | 101.7 | 13.2 |
| 81%–90% | 199 | 98.3 | 14.1 | 94.8 | 13.1 |
| 71%–80% | 98 | 94.2 | 12.9 | 95.5 | 13.4 |
| 61%–70% | 56 | 93.1 | 13.3 | 94.6 | 13.5 |
| 51%–60% | 43 | 86.3 | 13.0 | 87.7 | 13.2 |
| ≤50% | 24 | 84.0 | 16.3 | 86.0 | 15.8 |
| Mean WMT effort | N | FTNW errors left mean | FTNW errors left SD | FTNW errors right mean | FTNW errors right SD |
|---|---|---|---|---|---|
| 91%–100% | 272 | 1.5 | 2.3 | 1.8 | 2.3 |
| 81%–90% | 65 | 1.7 | 2.3 | 2.1 | 2.2 |
| 71%–80% | 24 | 2.4 | 2.8 | 3.1 | 2.8 |
| 61%–70% | 16 | 2.4 | 2.5 | 2.1 | 2.1 |
| 51%–60% | 11 | 3.3 | 3.1 | 4.1 | 3.5 |
| ≤50% | 4 | 7.2 | 7.9 | 8.5 | 8.3 |
| Mean WMT effort | N | Grip strength right (Kg) mean | Grip strength right SD | Grip strength left (Kg) mean | Grip strength left SD |
|---|---|---|---|---|---|
| 91%–100% | 813 | 41.4 | 14.2 | 38.1 | 13.6 |
| 81%–90% | 218 | 39.4 | 13.6 | 38.0 | 13.3 |
| 71%–80% | 119 | 36.9 | 16.4 | 35.3 | 14.8 |
| 61%–70% | 63 | 38.0 | 16.6 | 36.7 | 16.0 |
| 51%–60% | 55 | 33.6 | 14.6 | 32.5 | 14.2 |
| ≤50% | 39 | 31.7 | 14.2 | 31.6 | 12.5 |
| Mean WMT effort | N | Finger tapping speed right mean | FT right SD | Finger tapping speed left mean | FT left SD |
|---|---|---|---|---|---|
| 91%–100% | 529 | 48.8 | 8.9 | 45.3 | 8.6 |
| 81%–90% | 134 | 45.3 | 11.2 | 42.7 | 9.3 |
| 71%–80% | 63 | 43.3 | 11.1 | 40.7 | 9.2 |
| 61%–70% | 32 | 44.9 | 10.6 | 42.8 | 10.0 |
| 51%–60% | 26 | 38.0 | 11.9 | 37.4 | 12.0 |
| ≤50% | 15 | 34.7 | 15.4 | 36.0 | 13.8 |
| Mean WMT effort | N | Grooved Pegboard right (secs) mean | Grooved Pegboard right SD | Grooved Pegboard left (secs) mean | Grooved Pegboard left SD |
|---|---|---|---|---|---|
| 91%–100% | 813 | 72.2 | 24.4 | 81.3 | 32.9 |
| 81%–90% | 218 | 80.3 | 22.2 | 86.2 | 24.3 |
| 71%–80% | 119 | 92.6 | 51.2 | 90.5 | 29.6 |
| 61%–70% | 63 | 82.8 | 18.9 | 90.5 | 18.5 |
| 51%–60% | 55 | 109.6 | 55.4 | 116.2 | 61.4 |
| ≤50% | 39 | 108.4 | 55.1 | 123.6 | 96.3 |
| Mean WMT effort | N | WCST perseverative errors mean (percentile rank) | WCST categories mean | WCST categories SD |
|---|---|---|---|---|
| 91%–100% | 813 | 51.3 | 5.2 | 1.5 |
| 81%–90% | 218 | 42.1 | 4.5 | 1.9 |
| 71%–80% | 119 | 38.7 | 4.4 | 1.9 |
| 61%–70% | 63 | 33.4 | 4.2 | 2.0 |
| 51%–60% | 55 | 26.9 | 3.3 | 2.3 |
| ≤50% | 39 | 11.2 | 2.1 | 2.3 |
| Mean WMT effort | N | Category Test errors mean | Category Test errors SD |
|---|---|---|---|
| 91%–100% | 674 | 55.1 | 29.5 |
| 81%–90% | 164 | 66.2 | 28.9 |
| 71%–80% | 77 | 73.3 | 28.2 |
| 61%–70% | 44 | 70.7 | 28.2 |
| 51%–60% | 30 | 91.1 | 28.4 |
| ≤50% | 18 | 88.4 | 33.8 |
| Mean WMT effort | N | Digits forward (percentile) mean | Digits backward (percentile) mean | N | Visual Memory Span forward (percentile) | Visual Memory Span backward (percentile) |
|---|---|---|---|---|---|---|
| 91%–100% | 675 | 49.3 | 58.7 | 630 | 56.8 | 65.6 |
| 81%–90% | 178 | 41.4 | 51.2 | 166 | 46.7 | 53.1 |
| 71%–80% | 95 | 27.1 | 37.6 | 88 | 38.8 | 46.9 |
| 61%–70% | 54 | 31.7 | 35.9 | 49 | 32.8 | 41.3 |
| 51%–60% | 42 | 20.6 | 33.3 | 36 | 20.4 | 32.1 |
| ≤50% | 30 | 11.5 | 14.2 | 21 | 17.7 | 29.4 |
| Mean WMT effort | N | Thurstone Word Fluency mean | Thurstone Word Fluency SD | N | Ruff FFT total designs mean | Ruff FFT total designs SD |
|---|---|---|---|---|---|---|
| 91%–100% | 513 | 51.1 | 17.8 | 611 | 76.8 | 22.6 |
| 81%–90% | 105 | 44.0 | 16.4 | 145 | 65.2 | 23.6 |
| 71%–80% | 49 | 38.5 | 15.5 | 64 | 61.7 | 21.9 |
| 61%–70% | 23 | 43.3 | 17.9 | 35 | 63.2 | 24.2 |
| 51%–60% | 19 | 35.5 | 18.6 | 27 | 61.7 | 17.7 |
| ≤50% | 10 | 37.0 | 17.2 | 14 | 52.6 | 21.5 |
| Mean WMT effort | N | Gorham’s Proverbs mean | Gorham’s Proverbs SD | Emotional Perception Test (errors/45) mean | Emotional Perception Test (errors/45) SD |
|---|---|---|---|---|---|
| 91%–100% | 648 | 11.1 | 5.1 | 9.0 | 4.1 |
| 81%–90% | 149 | 8.6 | 4.4 | 10.7 | 4.4 |
| 71%–80% | 77 | 9.0 | 4.9 | 10.4 | 4.3 |
| 61%–70% | 37 | 8.3 | 4.5 | 11.5 | 4.9 |
| 51%–60% | 26 | 9.5 | 5.7 | 14.3 | 5.4 |
| ≤50% | 15 | 7.5 | 4.6 | 13.5 | 6.4 |
| Mean WMT effort | N | Smell test (right) mean | Smell test (right) SD | Smell test (left) mean | Smell test (left) SD |
|---|---|---|---|---|---|
| 91%–100% | 813 | 5.2 | 2.6 | 5.6 | 2.7 |
| 81%–90% | 218 | 4.5 | 2.5 | 4.6 | 2.6 |
| 71%–80% | 119 | 4.4 | 2.9 | 5.0 | 2.9 |
| 61%–70% | 63 | 3.6 | 2.8 | 4.1 | 2.6 |
| 51%–60% | 55 | 3.6 | 2.6 | 3.7 | 2.7 |
| ≤50% | 39 | 3.5 | 2.4 | 3.5 | 3.2 |
| Mean WMT effort | N | BJLO mean | BJLO SD | CVMT delay mean | CVMT delay SD |
|---|---|---|---|---|---|
| 91%–100% | 653 | 24.7 | 4.2 | 4.2 | 1.5 |
| 81%–90% | 169 | 23.8 | 4.4 | 3.6 | 1.6 |
| 71%–80% | 87 | 22.7 | 4.4 | 4.2 | 1.5 |
| 61%–70% | 49 | 21.7 | 5.8 | 2.8 | 1.5 |
| 51%–60% | 43 | 18.5 | 5.1 | 2.0 | 2.0 |
| ≤50% | 32 | 15.3 | 6.7 | 1.5 | 1.3 |
The effects of effort on California Verbal Learning Test memory test scores
The data in Table 1 show a very strong correlation between scores on the effort subtests of the WMT and CVLT recall scores. This relationship was duplicated in a very large sample studied independently by Dr. Roger Gervais (see Table 5 ). The data suggest that effort measured by the WMT recognition memory subtests (IR and DR) is an underlying variable that strongly influences CVLT recall scores. The alternative explanation, which is that the WMT effort scores correlate so strongly with CVLT scores in such large samples because they tap memory ability, can be dismissed as implausible and contrary to large amounts of data. First, a strong relationship between WMT effort subtests and other test scores can be seen in all of the tables in this article, but most of the tests are not memory tests. Second, the quintessential measure of ability is intelligence, but children of higher intelligence scored no higher on WMT recognition subtests than children of lower intelligence . Age invariably has an effect on ability tests in children; however, in the latter study, children tested clinically and aged between 7 and 10 years did not score significantly lower on the WMT effort subtests than children aged 11 to 18 years. The children scored the same as adults seeking custody of their children, consistent with the likelihood that WMT recognition subtests (IR and DR) primarily measure effort rather than ability.
The latter argument is further supported by greater scores on WMT effort subtests in a group of people who had severe brain injuries than in a group who had very mild head injuries, an effect which is best explained by poor effort in the mild group . Similar effects were found in compensation-seeking cases using another very easy effort test, called the Computerized Assessment of Response Bias (CARB). Those who had the most severe brain injuries scored higher on the CARB than those who had the most minor head injuries .
The WMT recognition memory subtests are extremely easy. In the original group of 40 normal adult controls , the median score was 100% on both IR and DR. Healthy adult volunteers in the study of Tan and colleagues scored a mean of 99.5% correct on WMT IR (SD = 2.3) and 99.5% correct on WMT DR (SD = 0.7). Mentally retarded adults in an institution in Germany scored a mean of 96% (SD = 5) on WMT DR . Hence, someone who fails WMT by scoring 82.5% or lower is scoring considerably lower than mentally retarded adults. Similarly, almost perfect scores on WMT effort subtests are obtained from adults or children who have neurological diseases or severe traumatic brain injury if they make an effort . Neurological patients who had impaired verbal memory on the CVLT scored approximately 96% correct on WMT recognition subtests, which was no lower than those who had normal verbal memory . A group of neurological patients tested by Gorissen and colleagues scored a mean of 95% correct (SD 9.4) on the WMT DR subtest. Children who had various clinical conditions, such as fetal alcohol syndrome (FAS), obtained mean scores well above 90% correct on WMT recognition subtests, and the children tested clinically performed just as well as adults seeking custody of their children . These studies show that the WMT recognition subtests are very insensitive to differences in levels of ability.
On the other hand, the WMT effort subtests are very sensitive to poor effort. Highly educated volunteer simulators, mainly psychologists and physicians, were asked to fake memory impairment but to avoid being detected. They scored only 71% on WMT IR and 67% correct on the WMT DR subtest . In an independent study by Tan and colleagues , volunteers who were asked to simulate brain injury obtained mean scores of 65% correct on WMT IR (SD = 18) and 64% correct (SD = 18) on WMT DR. Using a score of 82.5% or lower on WMT IR, DR, or Consistency to define poor effort, the WMT was found to be 100% accurate in classifying good versus poor effort in the latter study. Similar reports of 99% to 100% accuracy in classification of simulators versus good effort cases come from three other studies using the WMT in German , Turkish , and Russian (S. Tydecks and T. Merten, personal communication, 2005).
The results of the latter studies support the notion that WMT recognition subtests are very sensitive to poor effort and highly specific to poor effort, but they are virtually insensitive to differences in ability. Failed WMT recognition scores (≤82.5%) are invariably suggestive of poor effort because they are substantially lower than those obtained by mentally retarded adults (96%, SD = 5), by neurologically impaired patients, who are known to have impaired verbal memory (95%, SD = 5), or by children who have FAS (96%, SD = 6). Scores on WMT effort subtests that are substantially lower than the mean scores from the latter groups suggest low effort, especially where the clinical history does not suggest impairment as great as that of the latter groups (eg, cases of mild head injury in otherwise healthy adults). Exceptions would include some people who have dementia and children who have less than a grade three reading level.
In the current study, six cases of dementia, all in need of full-time supervision and guardianship, were given the computerized WMT, and their mean scores on WMT were IR, 85.4% (SD = 14), DR 82% (SD = 21), and Consistency, 82% (SD = 17). Although this is a very small sample of dementia patients, the latter scores are similar to the WMT data from adults who had early dementia tested by Brockhaus and Merten using the German WMT . It is clear that some patients who have dementia are unable to pass the WMT IR and DR subtests, even if they try their best to do so. To assist in the interpretation of WMT scores in people who might genuinely be unable to pass the WMT recognition subtests, the WMT Windows program contains mean scores and standard deviations from all WMT subtests in groups of early and late dementia, as well as data from 59 other comparison groups, with a total of more than 3000 cases.
Effort explains more test variance than brain injury severity
In 421 cases of traumatic brain injury for whom GCS scores were available, the correlation was only 0.17 between GCS and the mean of seven CVLT scores (trials 1 and 5, short- and long-delayed, free and cued recall and recognition hits). Yet in the same cases, the mean WMT effort scores correlated with mean CVLT scores at 0.58. Hence, GCS explained 3% of the variance in CVLT scores, whereas effort explained more than ten times the variance (34%). In non–brain-injured cases, the correlation between WMT effort and CVLT scores was 0.65.
Members of the head injury sample in Table 4 all passed the WMT effort subtests. Note that the mean CVLT SD free recall score in the group with a GCS of 3 was 9.1, compared with a mean of 10.2 in the group with a GCS of 15—hardly any difference. In contrast, the 745 cases scoring in the top range of WMT effort in Table 1 obtained mean scores of 10.7 on CVLT short-delayed free recall, whereas those in the lowest effort range scored 4.4. Based on these data, although brain injury has some impact, CVLT scores are influenced far more by the effort being made by the person taking the test than they are by severity of brain injury.
Abnormal brain scan versus effort
The correlation between CVLT mean scores and the presence or absence of abnormal CT or MRI brain scans in 456 cases of head injury was effectively zero (r = .01). In 321 traumatically brain injured or neurological patients who had normal CT or MRI brain scan results, the mean of the CVLT short- and long-delayed, free recall scores was 9.3 (SD = 3.7). This was not significantly different from the mean score of 8.9 (SD = 3.7) in 314 cases who had abnormal brain scans; however, poor effort obscured a true group difference. After removing cases who failed the WMT, the mean CVLT free recall score in those who had a normal brain scan was 11.1 (SD = 3.1, n = 174) compared with 9.9 (SD = 3.2, n = 220) in those who had an abnormal scan (F 12.9, 1, 392, P < .001). The mean difference of 1.2 points is significant but it is minor in comparison with the effects of effort. In the whole sample, the mean CVLT free recall score for those who passed the WMT (n = 831) was 10.8 (SD = 3.1), compared with 7.3 (SD = 3.4) in those who failed the WMT effort subtests (n = 370; F 303.5, 1, 199, P < .0001). The mean relative decrement of 3.5 CVLT free recall points associated with failing the WMT is almost three times larger than the effect of a CT or MRI brain abnormality.
Mild versus severe brain injury
Paradoxically, the mean WMT effort score of 87% (SD = 14) in the mild head injury cases (median GCS = 15, median PTA = 0, n = 469) was significantly lower than the mean score of 92% (SD = 9.6) from cases who had the most severe brain injuries (median GCS = 7, median post traumatic amnesia (PTA) = 336 hours, n = 148; F = 15, 1, 615, P < .0001). Using the usual cutoffs, 37.5% of the mild group failed the WMT, but the failure rate in the cases who had more severe brain injuries was only 21.6%. In fact, the highest failure rate of 47% was in 223 people who had mild head injuries and who were given a CT scan that showed no brain abnormality. These results are understandable in terms of poorer effort in the mild group. They would not be explainable as an effect of actual impairment caused by brain tissue injury, because those who had the most severe head injuries had the highest scores on the WMT effort subtests.
Given that effort is lower in mild versus severe brain injury groups on average, it is necessary to control for effort when comparing these groups on other tests. To study group differences caused by brain injury severity, we need to select groups of people who are all making a full effort on tests. In fact, there was no significant difference between mild and severe brain injury patients in their mean CVLT scores before WMT failures were dropped. Including only those with presumed valid test results (ie, passing the WMT), there were 293 cases of mild head injury, compared with 103 cases of moderate to severe brain injury. The mild group had a median GCS of 15 and a median PTA of zero, whereas the more severe brain injury group had a median GCS of 9 and a median PTA of 204 hours.
The mean CVLT free recall score was 10.8 (SD = 3.0) in the mild group compared with 9.9 (SD = 3.1) in the more severe injury group, a mean difference of 0.9 points, which is statistically significant ( P < .02). On the other hand, it is quite small in comparison with the difference of 6.3 points in short-delayed, free recall scores between those in the top range of effort on WMT in Table 1 (mean 10.7, SD = 3.2) and those in the lowest range (mean 4.4, SD = 2.6). It is important to note that in the mild head injury group who failed the WMT effort subtests, the mean CVLT short-delay, free recall score was 7.4 (SD = 3). Therefore, the lowest CVLT recall scores were found not in the most severe brain injury group but, on the contrary, in the group who had the least severe brain injuries, who showed poor effort.
Trail Making Test and Category Test in cases of mild versus severe brain injury
Similar findings were obtained when comparing the above mild and severe brain injury groups on other tests, such as the Trail Making Test and the Category Test. There was only a 20-second difference on Trail Making B between the groups who had mild versus severe brain injuries noted above, who passed WMT. Their mean scores were 69 and 89 seconds, respectively (SD = 28 and 61). Yet, 314 cases who failed the WMT took 132 seconds (SD 106) on Trail Making B, which was 43 seconds longer than those who had severe brain injuries and 54 seconds longer than the mean for all 733 patients who passed the WMT (77.7 seconds, SD = 48). Those in the top effort range in Table 9 took 76 seconds on Trail Making B, whereas those in the bottom effort range took 160 seconds (ie, 84 seconds longer). The mild head injury patients who failed the WMT took a mean of 128 seconds to complete Trail Making B, which is considerably worse than the severe brain injury patients passing WMT.
On the Category Test, the mild head injury group passing WMT made 51 errors (SD 27), compared with the more severe brain injury group, with 59 errors (SD 31). This is a significant difference in the expected direction, but 8 points is a small difference compared with the 33-point spread of Category Test errors as a function of effort shown in Table 16 (55 to 88). Also, it is small compared with the average effect of failing the WMT. In 743 cases who passed the WMT, the mean Category Test error score was 56 (SD = 29), but in the 264 cases who failed the WMT, the mean error score was 74 (SD = 30). The latter mean difference caused by effort (18 errors) is more than twice as large as the difference between mild and severe brain injuries (8 errors). The mean Category Test error score in patients with mild head injuries who failed the WMT was 72 errors (SD = 28), which is greater than that of the above severe brain injury patients who passed the WMT (59 errors, SD = 31).
The degree to which effort affected neuropsychological test scores in the current study was so much greater than the degree to which brain injury affected these scores that it would be prudent to measure effort in anyone given the CVLT, the Category Test, the Trail Making Test, or other neuropsychological tests. If we observe an impaired score on any of these tests, a hypothesis that must be ruled out is that poor effort explains the low score.
Independent replication
In Table 5 , the results are shown from an independent sample of 678 outpatients who were given the CVLT as part of psychological assessments by Dr. Roger Gervais in Edmonton, Canada. They were predominantly sent for vocational assessment or general psychological assessment after a work-related injury, with diagnoses including major depression, orthopedic injury, post-traumatic stress disorder, and various other conditions. The Gervais sample contained very few cases who had a primary diagnosis of head injury or neurological disease. It may be seen that the Gervais sample also shows steady decreases in CVLT recall scores as effort on the WMT decreases, strongly replicating the findings with the current independent sample of 1307 cases.
The effects of effort on other neuropsychological test scores
In Table 6 , scores on Warrington’s Recognition Memory Tests for words and faces are strongly related to WMT measured effort [(IR + DR + Consistency)/3]. The mean WMT effort score correlated at r = 0.73 with Warrington’s RMT for Words (n = 465) and at r = 0.52 with Warrington’s RMT for Faces (n = 1025). Also affected by effort are immediate and delayed story recall scores (see Table 7 ), memory on the Rey Complex Figure Test (see Table 8 ) and memory on the Continuous Visual Memory Test (see Table 21 ).
The effects of effort are just as clear on non-memory tests as they are on memory tests, as shown in Tables 9–21 . Times taken to complete Trail Making A and B increase steadily as WMT effort scores decrease (see Table 9 ). Performance IQ (PIQ)and Verbal IQ (VIQ) scores decline as effort declines (see Table 10 ). Even manual test scores reduce in a predictable way as effort decreases, as shown in Tables 11–14 (Finger Tip Number Writing, Grip Strength, Finger Tapping Speed, and Grooved Pegboard). In people who had severe brain injuries and who passed WMT, the mean right hand finger tap score was 49.6 (SD = 7), whereas in those who had mild head injuries and who failed WMT, the mean score was 42.6 (SD = 12). Once again, effort has more effect than brain injury.
Abstraction and problem solving tests are no exception to the general rule. The Wisconsin Card Sorting Test and Category Test are very susceptible to the influences of effort (see Tables 15 and 16 ). Digit Span, Visual Memory Span, Thurstone’s Word Fluency, and Ruff Figural Fluency are also strongly affected by effort, as measured by the WMT (see Tables 17 and 18 ). Scores on tests as diverse as proverb interpretation, judgment of emotion in tone of voice, judgment of the angles of lines, visual memory, and the ability to identify odors are significantly affected by effort, as measured by the WMT (see Tables 19–21 ). Although not shown in the tables, scores on Wide Range Achievement Test (WRAT) reading, spelling, and arithmetic, and on the Paced Auditory Serial Addition Test (PASAT) were all significantly correlated with WMT effort scores.
Table 22 shows that effort, as measured by the WMT, is strongly linked with effort measured by other symptom validity tests. The mean WMT effort score correlated at 0.61 with computerized assessment of response bias (CARB) , 0.6 with the Amsterdam, and 0.6 with the 21-Item Test. In the Gervais sample shown in Table 5 , the correlation between the mean WMT effort score and the Test of Memory Malingering (TOMM trial two) was 0.68. WMT effort scores were also significantly negatively correlated with all symptom self-rating scales, including the symptom checklist (SCL)90-R positive symptom total (-0.26), Beck Depression Inventory (-0.24), the Minnesota Multiphasic Personality Inventory (MMPI)-2 F scale (-0.22), the MMPI-2 D scale (-0.24) and the Memory Complaints Inventory (-0.4).
Related posts:
 At a Threshold: Making Decisions When You Don’t Have All the Answers
The Use of Functional MRI in Traumatic Brain Injury Diagnosis and Treatment
Erratum
Pain and Traumatic Brain Injury
Cognitive Rehabilitation: Where We Are and What is on the Horizon
Designs for Strong Minds’ Cognitive Rehabilitation for Mild or Moderate Posttraumatic Head Injuries
At a Threshold: Making Decisions When You Don’t Have All the Answers
The Use of Functional MRI in Traumatic Brain Injury Diagnosis and Treatment
Erratum
Pain and Traumatic Brain Injury
Cognitive Rehabilitation: Where We Are and What is on the Horizon
Designs for Strong Minds’ Cognitive Rehabilitation for Mild or Moderate Posttraumatic Head Injuries
Stay updated, free articles. Join our Telegram channel

Full access? Get Clinical Tree


