Abstract
Background
The Functional Reach Test (FRT) is a clinical assessment of the risk of falls in elderly or disabled subjects. However, the FRT is complex (involving the leg, hip and trunk joints) and previous studies have shown that several different strategies can be used to complete the test.
Objectives
To describe the strategies used by healthy, adult subjects when performing the FRT and to assess the influence of age on choice of the strategy.
Method
This was a pilot study in which 29 non-fallers (18 under-50s and 11 over-75s) were asked to perform the FRT on a force platform in a motion analysis laboratory. A total of 18 reflective markers were placed on the body. The main outcome measures were the FRT score, the centre of pressure (CoP) excursion, and kinetic and kinematic test data. The two age groups were compared using a non-parametric, two-sample Mann-Whitney U test. A cluster analysis of the entire population grouped subjects together according to their functional similarities.
Results
The older subjects displayed a smaller CoP anteroposterior displacement ( P < 0.01), greater backwards displacement of the pelvis ( P < 0.05) and less trunk rotation during the FRT ( P = 0.024) than the younger subjects. The cluster analysis split the population into two groups, which differed in terms of age, FRT score, pelvis translation, and CoP displacement.
Conclusion
Our results suggest that at the moment of trunk flexion, elderly subjects use pelvic translation in order to limit forward displacement of the CoP and prevent forward imbalance.
Résumé
Contexte
Le Functional Reach Test (FRT) est une méthode d’évaluation clinique du risque de chute de la personne âgée ou handicapée. Cependant le FRT est un test complexe mettant en jeu les articulations des membres inférieurs et du tronc, et de précédentes études ont montré que différentes stratégies pouvaient être utilisées pour réaliser le test.
Objectifs
Décrire les stratégies de réalisation du FRT utilisées par des personnes adultes et saines et évaluer l’influence de l’âge dans le choix de la stratégie.
Méthode
Il s’agissait d’une étude pilote. Il était demandé à 29 personnes, non chuteuses (18 de moins de 50 ans, 11 de plus de 75 ans), de réaliser le FRT sur une plateforme de force dans un laboratoire d’analyse du mouvement. Dix-huit marqueurs réfléchissants étaient placés sur le corps. Les principales mesures prises en compte étaient le score au FRT, le déplacement du centre de pression (CdP) et les données cinétiques et cinématiques enregistrées au cours du test. Les deux groupes d’âge étaient comparés en utilisant le test non paramétrique de Mann-Whitney. Une analyse par cluster sur la population totale a permis de grouper les sujets en fonction de similarités fonctionnelles.
Résultat
Les sujets les plus vieux produisaient un plus petit déplacement antéro-postérieur du CdP ( p < 0,01), un plus grand déplacement vers l’arrière du bassin ( p < 0,05) et moins de rotation de tronc ( p = 0,024) durant le FRT que les sujets plus jeunes. L’analyse par cluster a permis de séparer la population en deux groupes qui différaient en âge, en score de FRT, en déplacement du bassin, en déplacement du CdP.
Conclusion
Nos résultats suggèrent qu’au moment de la flexion du tronc, les sujets plus âgés utilisent une translation du bassin afin de limiter le déplacement du CdP pour prévenir un déséquilibre vers l’avant.
1
English version
1.1
Introduction
Postural instability is frequent in the elderly and its consequences constitute a major public health issue. The detection, analysis and understanding of alterations in balance and gait are part of routine clinical practice. Many different fall-risk screening tests have been introduced; one of the most common is the Functional Reach Test (FRT) .
The FRT evaluates the forward stability of a standing subject who voluntarily extends one arm as far forward as possible in the horizontal plane, while keeping both heels in contact with the ground. The score is obtained by measuring the distance between fingertip’s starting and end position.
The FRT’s good reliability and low inter-examiner variability have been demonstrated in a range of studies . The FRT score correlates with the anteroposterior excursion of the centre of pressure (CoP) . Furthermore, the FRT also shows good reproducibility over time and is sensitive to change . Lastly, the FRT score is known to decrease with age, and an abnormally low score is a good predictor of the risk of falls .
Performance of the FRT involves flexion of the leg, hip and trunk joints. Hence, several different strategies can be used to achieve the same FRT score. For example, it is known that older people tend to flex more at the hips and younger people are more likely to flex their ankles .
A few studies have looked at whether flexion strategies have an impact on the FRT score. Takasaki et al. performed a video analysis of FRT performance in a large sample of subjects and proposed an empirical classification of strategies. Wernick-Robinson et al. used a movement analysis system and force platforms to explore FRT strategies in healthy subjects and in individuals with impaired vestibular function.
Our starting hypothesis was that different movement patterns can be used to perform the FRT; these may have an impact on test performance and may be age-dependant. We used a quantitative movement analysis device to investigate this hypothesis.
1.2
Methods
The study was performed in compliance with the tenets of the Declaration of Helsinki.
1.2.1
Subjects
Twenty-nine volunteers (18 under-50s and 11 over-75s) were included in the study. They were recruited from among hospital staff and their family members. A detailed information sheet was handed over prior to inclusion in the study. All subjects gave their written, informed consent to participation.
We excluded subjects reporting two or more falls in the previous 12 months and those with neurological or musculoskeletal disorders that prevented either standing for at least 30 min or movements required 90 degrees of shoulder flexion. For included patients, any fall in the previous 12 months must have been due to extrinsic causes. All analyzed study participants met the inclusion criteria.
1.2.2
Instrumentation
Trunk and limb movements were recorded by using an optoelectronic system VICON 370 (Oxford Metrics Ltd, UK) with six infrared cameras and a sampling frequency of 50 Hz.
Ground reaction forces were recorded on a force platform (the OR6 from AMTI, Watertown, USA) synchronised with the VICON system.
1.2.3
Procedure
After the investigator had explained and demonstrated the FRT, the subject first performed the conventional, clinical FRT while standing alongside a wall. The examiner noted the score (in millimetres).
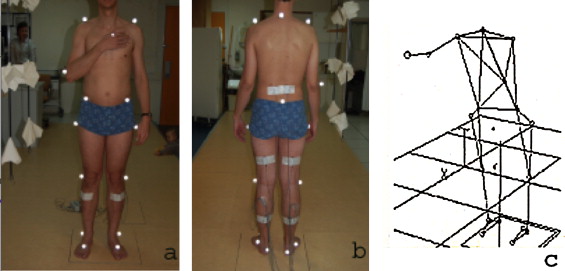
The FRT was then performed in the motion analysis laboratory. The subject was equipped with 18 markers ( Fig. 1 ) located on the first sacral process (FSP), the anterior superior iliac spines (ASISs), the greater trochanters, the lateral femoral condyles, the lateral malleoli, the tip of the metatarsophalangeal joint of the second toe on each foot, the heels, the acromia, the C7 process, the right epicondyle and the tip of the metacarpophalangeal joint of the right index finger.

The subject then stepped onto the force platform and stood in an upright but relaxed position.
The recording started with the subject in the standing position and with the right index finger pointing forward for 10 s. Upon hearing an auditory cue, the subject initiated the test at the speed of his/her choice. The subject leant forward as far as possible without moving his/her feet. The recording was stopped when the subject took his/her heel(s) off the ground or when his/her index finger reached the maximum distance.
Five consecutive trials were recorded. The test instructions were repeated before each trial.
1.2.4
Data recorded
1.2.4.1
Clinical data
The FRT score (in mm).
Static parameters recorded in the motion analysis laboratory:
- •
the centre of pressure (CoP): anteroposterior displacements (APD) (in mm) at the 90th percentile and the total displacement distance (TDD);
- •
the angular positions at rest for the back (the angle between the C7-sacrum line and the horizontal plane), hips (the angle between the pelvis plane and the great trochanter-knee line), knees (the angle between the great trochanter-knee line and the knee-ankle line) and ankles (the angle between the knee-ankle line and the heel-toe line).
Parameters recorded or calculated during movement in the motion analysis laboratory:
- •
the FRT score;
- •
the movement duration;
- •
the CoP: APD (in mm) at the 90th percentile, the TDD and the TDD/APD ratio (referred to as the CoP index);
- •
trunk flexion (the angle between the C7-sacrum line and the horizontal plane) and twisting (the angle between the vertical plane and the bi-acromial line) at the end of the movement;
- •
pelvic movements: anteroposterior displacements of the centre of the triangle formed by the markers on the FSP and the two ASISs;
- •
joint angles at the beginning of the test and the range of joint motion during the test.
1.2.5
Statistical analyses
For each subject and each parameter, the values from the five trials were averaged. Qualitative data were analyzed as percentages.
The non-parametric, two-sample Mann-Whitney U test was used to compare the data from the under-50 group and the over-75 group.
The threshold for statistical significance was set to P < 0.05.
Relationships between clinical and instrumental FRT parameters were examined by calculating Pearson’s correlation coefficient.
An ascendant hierarchical clustering analysis (using Ward’s method, based on Euclidean distances ) was used to group subjects together according to their age, height, COP excursion and motion analysis parameters during the FRT. Outliers (exceeding two standard deviations) were replaced by the mean value. Subjects in whom more than two-thirds of the data were outliers were excluded from the analysis.
A one-way analysis of variance and a subsequent post-hoc Tukey test were used to probe the statistical significance of the intergroup differences in the various movement parameters. The threshold for statistical significance was set to 5%.
1.3
Results
1.3.1
Demographic and clinical FRT data
The two groups (the under-50s and the over-75s) did not differ significantly in terms of mean weight and height ( Table 1 ). The FRT score was significantly lower in the over-75 group than in the under-50 group ( P = 0.003).
| < 50 years | > 75 years | P | |
|---|---|---|---|
| Clinical FRT (mm) | 419.4 ± 88.9 (310 to 690) | 285.5 ± 118.2 (160 to 500) | < 0.01 |
| Parameters recorded in the static position | |||
| CoP Total displacement distance (mm) | 242.8 ± 54.8 | 300.6 ± 61.1 | < 0.05 |
| CoP Anteroposterior displacement (mm) | 10.2 ± 2.7 | 13.2 ± 4.6 | < 0.05 |
| BACK | 86.2 ± 2.8 | 80.3 ± 5.9 | NS |
| HIP | |||
| Left | 85 ± 9.2 | 89.5 ± 5.42 | NS |
| Right | 85.8 ± 8.6 | 90.2 ± 5.41 | NS |
| KNEE | |||
| Left | 7.8 ± 4.9 | 8.5 ± 6.1 | NS |
| Right | 8.1 ± 5.7 | 9.2 ± 6.9 | NS |
| ANKLE | |||
| Left | 82.8 ± 3.4 | 78.9 ± 11.6 | NS |
| Right | 81 ± 2.1 | 81 ± 4.8 | NS |
| Parameters recorded during movement | |||
| FRT in the lab condition (mm) | 367.8 ± 54.7 | 258.5 ± 79.8 | < 0.005 |
| FRT duration (sec) | 5.8 ± 2.2 | 6 ± 2.1 | NS |
| FRT speed (mm/s) | 73.7 ± 28.6 | 50.2 ± 21.5 | < 0.05 |
| CoP during FRT Total displacement distance (mm) | 336.3 ± 71.8 | 446.1 ± 155.8 | < 0.05 |
| CoP during FRT Anteroposterior displacement (mm) (mm) | 89.9 ± 24.4 | 51.55 ± 35.5 | < 0.01 |
| CoP during FRT INDEX | 4.1 ± 1.6 | 52.7 ± 113.3 | NS |
| Pelvic sagittal displacement (mm) | −10.8 ± 40.7 | −51.03 ± 31.5 | < 0.05 |
| Trunk flexion (°) | −53.5 ± 15.5 | −53.1 ± 12.3 | NS |
| Trunk rotation (°) | −15.8 ± 7.2 | −7.4 ± 9.3 | < 0.05 |
| Hip range of motion (°) | |||
| Left | −37.1 ± 12.6 | −48.9 ± 15.2 | 0.051 |
| Right | −34.3 ± 14.4 | −48.7 ± 16.5 | < 0.05 |
| Knee range of motion (°) | |||
| Left | −1.5 ± 8.8 | 5.6 ± 18.9 | NS |
| Right | −2.3 ± 9.6 | 6.1 ± 21.7 | NS |
| Ankle range of motion (°) | |||
| Left | 6.1 ± 3.2 | 5.4 ± 8.1 | NS |
| Right | 5.2 ± 3.4 | 4.3 ± 9.3 | NS |
1.3.2
Parameters recorded in the static position
The CoP TDD and APD values were significantly lower in the under-50 group ( P = 0.02 and P < 0.05, respectively). There were no intergroup differences regarding the resting positions of the leg and hip joints. However, we observed an intergroup difference in the static position of the spine ( P = 0.008).
1.3.3
Parameters recorded during movement
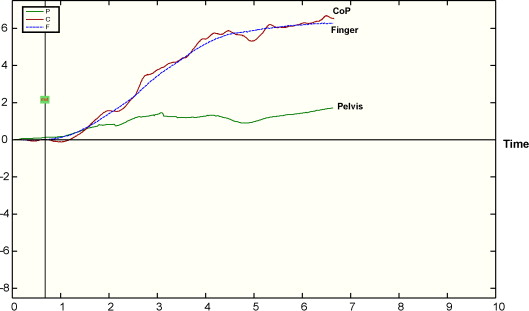
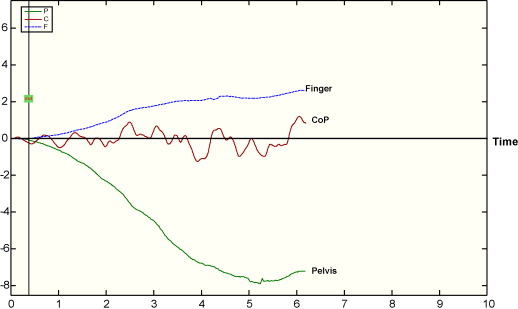
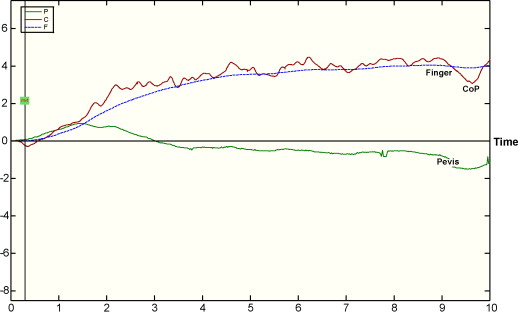
The FRT score was lower during the movement analysis than during the clinical examination. The clinical and movement analysis FRT scores were correlated (Pearson’s correlation coefficient = 0.6). The over-75 group again displayed a lower mean score than the under-50 group ( P = 0.028). Although there was no intergroup difference in the movement duration, the movement velocity was significantly greater in the under-50 group ( P = 0.039). The over-75 group displayed a greater CoP TDD ( P < 0.05) but a lower CoP APD ( P < 0.01). The pelvis moved forward in some subjects, backwards in others or even forwards and then backwards ( Figs. 2–4 ). Backward pelvic displacement was more ample in the over-75 group ( P < 0.05).
Relative to the under-50s, the over-75 subjects displayed less trunk rotation during the FRT ( P = 0.024). We did not observe any significant intergroup differences in trunk flexion, knee motion or ankle motion. The amplitude of right hip flexion was greater in the over-75 group ( P < 0.05), whereas the intergroup difference in left hip flexion did not achieve statistical significance ( P = 0.051).
At the end of the test, there were no significant differences between the two groups in terms of the hip, knee and ankle positions.
1.3.3.1
Cluster analysis
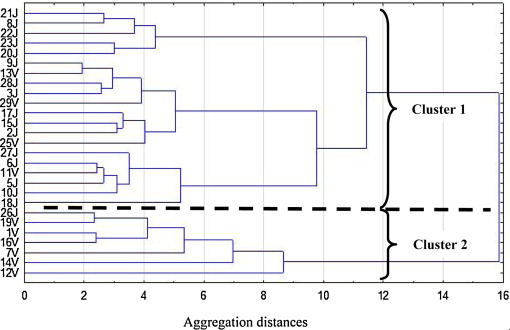
Two subjects (one in the under-50 group and one in the over-75 group) were excluded from the analysis because more than two-thirds of their parameters were outliers ( Fig. 5 , Table 2 ).
| ANOVA univariate with 2 classes | Classe 1 Mean ± SD | Classe 2 Mean ± SD | Post-hoc HSD Tuckey | |
|---|---|---|---|---|
| Age | 0.007 | 36.8 ± 19.3 | 67.3 ± 21.0 | 0.007 |
| FRT (mm) | 0.004 | 356.3 ± 65.4 | 259.8 ± 83.2 | 0.004 |
| Movement latency (s) | 0.036 | 0.3 ± 0.1 | 0.2 ± 0.1 | 0.037 |
| Pelvis range of motion | 0.002 | −8.0 ± 29.6 | −76.0 ± 29.5 | 0.002 |
| Sagittal displacement of CoP during FRT | 0.005 | 89.8 ± 24.4 | 43.1 ± 31.8 | 0.005 |
| Length CoP during FRT | 0.023 | 353.6 ± 61.5 | 432.0 ± 191.0 | 0.023 |
| Index CoP during FRT | 0.000 | 4.5 ± 2.1 | 62.6 ± 123.1 | 0.000 |
| Left ankle range of motion | 0.008 | 7.0 ± 1.9 | 11.3 ± 5.3 | 0.008 |
| Right ankle range of motion | 0.042 | 6.0 ± 2.3 | 11.0 ± 5.8 | 0.042 |
| Left knee range of motion | 0.007 | 4.8 ± 2.6 | 16.4 ± 20.4 | 0.007 |
| Right knee range of motion | 0.078 | 6.3 ± 2.4 | 18.3 ± 21.6 | |
| Left hip range of motion | 0.022 | 37.0 ± 10.0 | 56.6 ± 14.2 | 0.022 |
| Right hip range of motion | 0.022 | 34.9 ± 11.4 | 56.4 ± 15.9 | 0.022 |
| Trunk initial angle | 0.000 | 85.9 ± 3.5 | 79.6 ± 5.6 | 0.000 |
| Trunk final angle | 0.019 | 35.5 ± 13.5 | 22.1 ± 11.4 | 0.019 |
| Trunk rotation | 0.034 | −15.5 ± 7.2 | −5.9 ± 9.3 | 0.034 |
The ascendant hierarchical clustering analysis revealed two distinct clusters ( n = 7 and 20, respectively), with a Euclidean distance of 15.84. Calculation of the R ratio confirmed the existence of two distinct clusters.
The two groups differed significantly in terms of age, FRT score, pelvis translation, anteroposterior CoP displacement, total COP displacement, the CoP index, the ankle range of motion, the hip range of motion, trunk flexion and shoulder rotation.
The first, larger cluster ( n = 20 subjects, of whom 16 [80%] were under 50) stood straighter, had a higher FRT score and a longer CoP displacement ( Fig. 2 ), flexed their leg and hip joints less and performed a larger shoulder rotation during the test (relative to the second, smaller cluster).
The smaller cluster ( n = 7 subjects, of whom 6 were over 75) was associated with a lower FRT score and smaller CoP displacements ( Fig. 3 ). More ample trunk flexion was compensated by rearward translation of the pelvis and flexion of the ankle, knee and hip joints.
1.4
Discussion
We observed significant differences between under-50 adults and non-faller, over-75 adults in terms of the FRT score and the strategy adopted during the test. Our results are consistent with the literature data on the FRT score and the magnitude of the CoP excursion in the static position .
The clinical FRT score was always higher than that obtained in the motion analysis laboratory. During the clinical test, the proximity of the wall may have made the subjects less apprehensive of losing their balance. The marks on the wall may also have guided the subjects and increased their level of motivation.
The speed of test performance decreased with age, as evidenced by the shorter reach achieved over a similar duration. Kozak et al. also reported that older women performed the FRT more slowly than young women.
Reduced trunk rotation may explain (at least in part) the lower FRT score in older subjects. This finding was also reported by Cavanaugh et al. . However, the FRT primarily assesses the subject’s ability to displace his/her centre of gravity forwards. Aufauvre et al. have shown that the FRT score was well correlated with the greatest anterior CoP excursion. We found significant intergroup differences in the magnitudes of the CoP TDD and APD during the test, as also reported by Cavanaugh et al. . We did not find any difference between the two groups in terms of trunk flexion; this contrasts with the report by Kosak et al. , who observed an age-related decrease in trunk flexion during the FRT. In the present study, the older subject avoided a forward displacement of the CoP by moving the pelvis backwards, rather than by avoiding trunk flexion.
Greater hip and knee flexion in the over-75 group:
- •
lowered the centre of gravity (making the subject feel safer) and;
- •
reduced the activity of the calf muscles and the degree of hamstring stretch (which decreases with age).
Horak and Nashner described both a hip strategy and an ankle strategy for maintaining balance during anteroposterior balance perturbations . Takasaki et al. and Wernick-Robinson et al. defined an FRT hip strategy that involved at least 20° of hip flexion and just 5° of ankle flexion on both body sides. In our study, fifteen subjects (6 of the over-75s and 9 of the under-50s) adopted a hip strategy that matched these criteria.
An ankle strategy involves significant ankle plantar flexion and little hip flexion; this approach was not observed in the present study and was rarely observed in the studies by Takasaki et al. and Wernick-Robinson et al. . In our study, two subjects (one in each group) performed FRT with ankle plantar flexion but this was combined with ample knee flexion (i.e. similar to a squat). Indeed, a “squat” strategy was also observed in a few cases in the studies by Takasaki et al. and Wernick-Robinson et al.
In the present study, hip and ankle movements do not appear to be the best parameters for define movement strategies during the FRT. Knee flexion occurred more frequently than in the literature studies, and influenced hip and ankle position. The marked knee flexion during the FRT in the present study may be explained by our instrumental procedure, which does not provide horizontal landmarks that might facilitate performance of the test. In Takasaki et al.’s experiments, subjects leant forward while holding a horizontal, sliding bar with the right hand. This paradigm is similar to Duncan et al.’s description of the test, and maintenance of contact with the bar limits knee flexion.
In the present study, posterior translation of the pelvis was the kinematic parameter that best distinguished between the two main FRT strategies. Takasaki et al. also found that older adults moved their pelvis backward during the FRT, in order to limit anterior displacement of the CoP.
Force platform data are often used to assess balance in older subjects performing dynamic tasks . These data (especially CoP sagittal displacement and the CoP index) were very discriminant in the present study. This is not surprising, since people with poor balance or fear of falling tend to avoid displacements of the CoP. We conclude that the choice of strategy depends on the subject’s ability (or will) to move his/her CoP.
1.5
Conclusion
As reported in the literature, we found that the FRT score decreased with age.
The present study provides a better understanding of factors associated with a low FRT score. Performance in the FRT is linked to the ability to move the CoP forwards. In the FRT, elderly people avoid displacing their CoP by flexing the trunk and moving the pelvis backwards.
Cluster analysis enabled us to identify two movement strategies during the FRT. Although age was indeed one of the discriminant parameters in the cluster analysis, both “movement strategy groups” included subjects from the two age groups studied here.
It would be interesting to use the same methodology to study the FRT strategy used by older adults with frequent falls or with fear of falling.
Disclosure of interest
The authors declare that they have no conflicts of interest concerning this article.
2
Version française
2.1
Introduction
L’instabilité posturale est un phénomène fréquent chez la personne âgée et ses conséquences constituent un problème majeur de santé publique. La détection, l’analyse et la compréhension des perturbations de l’équilibre et de la marche font partie de la pratique quotidienne. De très nombreuses méthodes d’évaluation du risque de chute ont été proposées, l’une des plus communes est le Functional Reach Test (FRT).
La FRT évalue la stabilité vers l’avant d’une personne debout qui étend volontairement son bras en avant que possible dans un plan horizontal, pendant qu’elle garde les deux talons au contact avec le sol. Le score est obtenu en mesurant la distance entre la position du bout des doigts au départ et à l’arrivée.
Il a été démontré dans plusieurs études que le FRT est fiable et a une variabilité inter-examinateur faible. Le score du FRT est corrélé avec le déplacement antéro-postérieur du centre de pression (CdP) . De plus, le FRT a également une bonne reproductibilité dans le temps et est sensible au changement . Enfin on sait que le score du FRT diminue avec l’âge mais qu’un score anormalement bas et un bon prédicateur du risque de chute .
La réalisation du FRT fait participer les articulations de la cheville, du genou, de la hanche et du tronc; plusieurs stratégies de mise en jeu de ces articulations pourraient donc théoriquement arriver au même score de FRT. Par exemple, on sait que les sujets âgés ont tendance à plus fléchir leurs hanches et les sujets jeunes à plus réaliser une dorsiflexion de cheville pour se pencher en avant .
Peu d’études ont essayé de déterminer si la stratégie de réalisation influençait sur le score du FRT. Takasaki et al. ont réalisé une analyse vidéo du FRT sur un large échantillon d’individu et ont proposé une classification empirique des stratégies. Wernick-Robinson et al. ont utilisé un système d’analyse du mouvement et une plateforme de force pour déterminer les stratégies de réalisation du FRT chez des sujets sains et chez des sujets avec des fonctions vestibulaires altérées.
Notre hypothèse de départ est que différents schémas peuvent être utilisés pour réaliser le FRT, que ceux-ci peuvent avoir un impact sur le résultat du test et peuvent être liés à l’âge. Nous avons utilisé un système d’analyse du mouvement pour explorer cette hypothèse.
2.2
Méthode
L’étude a été conduite en conformité avec les principes de la déclaration d’Helsinki.
2.2.1
Sujets
Vingt-neuf volontaires (18 de moins de 50 ans, 11 de plus de 75 ans) ont été inclus dans l’étude. Ils ont été recrutés parmi le personnel de l’hôpital et les membres de leur famille. Une feuille d’informations détaillée leur a été remise avant toute inclusion dans l’étude. Tous les sujets ont donné leur consentement pour participer à l’étude.
Nous avons exclu les sujets ayant signalé deux chutes ou plus dans l’année précédent leur inclusion, ainsi que ceux qui présentaient des affections neurologiques ou musculo-squelettiques susceptibles soit de les empêcher de se tenir debout au moins 30 minutes, soit de fléchir l’épaule bras tendu à 90°. Pour les sujets retenus dans l’étude, toute chute survenue dans les 12 mois précédent l’inclusion devait avoir une cause extrinsèque.
Tous les sujets entrant dans l’analyse des résultats ont rempli les critères d’inclusion.
2.2.2
Instrumentation
Les mouvements des membres et du tronc étaient enregistrés grâce à un système opto-électronique Vicon 370 (Oxford Metrics Ltd, UK) avec 6 caméras infrarouges et une fréquence d’échantillonnage de 50 Hz. La force de réaction au sol était enregistrée sur une plateforme de force (OR6 de MATI Watertown États-Unis) synchronisée avec le système Vicon.
2.2.3
Procédure
Après que l’investigateur ait expliqué le FRT et réalisé une démonstration, le sujet réalisait d’abord le FRT conventionnel, clinique, en se tenant debout le long d’un mur. L’investigateur notait le score en millimètre. Le FRT était ensuite effectué dans le laboratoire d’analyse du mouvement. Le sujet était équipé de 18 marqueurs ( Fig. 1 ) placés sur le premier processus sacré, les épines iliaques antéro-supérieures, le grand trochanter, le condyle fémoral latéral, l’articulation métatarsophalangienne du 2 e rayon de chaque pied, les talons, les acromions, le processus épineux de C7, l’épicondyle droit, l’articulation métacarpophalangienne de l’index droit.
Related posts:
 The Annals of PRMkeep on moving forward
 Superimposed electrical stimulation improves mobility of pre-stiff thumbs after ulnar collateral ligament injury of the metacarpophalangeal joint: A randomized study
 Prognostic factors of long-term outcome in cases of severe traumatic brain injury
Contribution of behavioral and cognitive therapy to managing functional urinary disorders in woman
Prognostic factors of long-term outcome in cases of severe traumatic brain injury
Contribution of behavioral and cognitive therapy to managing functional urinary disorders in woman
 Feasibility of the Cognitive Assessment scale for Stroke Patients (CASP) vs. MMSE and MoCA in aphasic left hemispheric stroke patients
 Does adolescent idiopathic scoliosis relate to vestibular disorders? A systematic review
Stay updated, free articles. Join our Telegram channel

Full access? Get Clinical Tree


