The results of metal-on-metal hip Conserve® Plus resurfacings with up to 14 years of follow-up with and without risk factors of small component size and/or large femoral defects were compared as performed with either first- or second-generation surgical techniques. There was a 99.7% survivorship at ten years for ideal hips (large components and small defects) and a 95.3% survivorship for hips with risk factors optimized technique has measurably improved durability in patients with risk factors at the 8-year mark. The lessons learned can help offset the observed learning curve of resurfacing.
Metal-on-metal hip resurfacing (MMHR) is an attractive alternative to total hip replacement (THR); it provides a more anatomic and physiologic replacement, preserves more of the femoral bone, has lower dislocation rates, and has increased activity levels. Although at short-term follow-up MMHRs have comparable results to THR there are unique risks associated with resurfacing, such as femoral neck fracture. At short- or midterm follow-up, many studies have cited the importance of patient selection to prevent complications and optimize durability. Early survivorship results (>5 years) range between 93% and 99.14% and midterm results (between 5 to 10 years) between 91.5% and 95.7%. The long-term performance of metal-on-metal resurfacing implants has been shown affected by component size and the presence of large defects in the femoral head. Femoral size was found the best predictor of revision when all covariates were analyzed in birmingham hip resurfacings (BHR) in a study by McBryde and colleagues, a result corroborated by the annual report of the Australian Orthopaedic Association National Joint Replacement Registry. More recently, survivorship of hip resurfacings has been adversely affected by adverse local tissue reactions due to wear, a complication also related in part to small prosthetic size.
The purpose of the authors’ study was twofold: (1) to compare the long-term survivorship and clinical results between the hips with a femoral component size greater than 46 mm and head defects less than 1 cm (ideal hips) and those with at least one of the risk factors of femoral component size less than 46 mm and femoral head defect greater than 1 cm and (2) to assess the effects of a modified surgical technique on the survivorship of both ideal hips and hips with risk factors.
Materials and methods
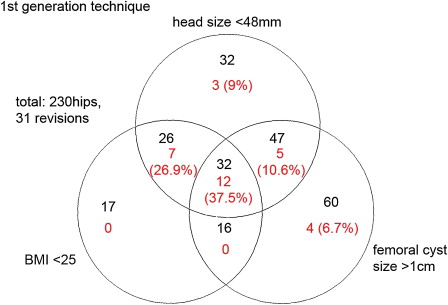
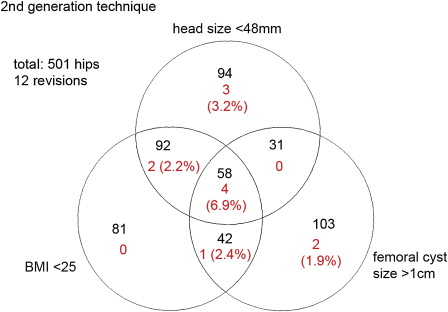
Between 1996 and 2008, the senior surgeon (HCA) implanted 1100 Conserve® Plus MMHR (Wright Medical Technology, Arlington, Tennessee) devices in 924 patients using the cementing technique recommended for the Conserve® Plus femoral component, leaving a l-mm cement mantle. The device is manufactured as cast cobalt-chrome material, which is heat treated, solution annealed, machined, and polished. The senior surgeon made several changes to the surgical technique, which happened over time, and second-generation changes were complete by hip #300 ( Table 1 ). Those changes were detailed in a previous study that compared the first-generation results with 6.8 years’ follow-up to the second-generation results with 4.5 years of follow-up. In previous reports based on a subsection of the present series, the independent effects of component size and presence of large femoral defects and body mass index (BMI) on the survivorship of the procedure were highlighted. Although component size and femoral head defects were associated with clear cutoff marks usable for hip selection, the effect of BMI was linear rather than dichotomous and did not allow suggesting value for patient selection. In addition, BMI is a variable that is associated with the patient and not the hip to be treated. Venn diagrams showing the number of hips with risk factors and the number of femoral revisions in the first and second generations show that all revisions are contained within the areas covered by small component size and large femoral defects ( Figs. 1 and 2 ). For these reasons, the authors elected to constitute the groups studied in the present study on the basis of component size and presence of femoral defects only, although a BMI of less than 25 in combination with other risk factors substantially affects the incidence of failure. Consequently, the authors’ study group was composed of 468 hips in 413 patients, selected because their femoral head size was greater than 46 mm and they presented femoral head defects smaller than 1 cm. Femoral defect size was measured from intraoperativephotos, as described in a previous publication. In this group, there were 404 male (97.8%) and 9 (1.3%) female patients. The mean age of the patients was 52.1 years (range 25.4–77.5). Of these patients, 109 patients had the contralateral side resurfaced but 54 of those hips did not meet the inclusion criteria for the ideal group. All acetabular components were uncemented and all the femoral components were cemented but, in addition, the short metaphyseal stem of the femoral component was cemented in 139 out of 468 hips. In the ideal group, 205 hips were implanted with the original 5-mm shell and 263 hips with the thin 3.5-mm shell, which was introduced in October 2003 and has been used in 97% of hips since that time, enabling a larger femoral and/or a smaller socket to be inserted. The two shells were designed with identical bearing surfaces and their mechanical properties are comparable.
| First Generation | Second Generation | |
|---|---|---|
| Suction | No suction (first 100 hips) | Dome suction |
| Drilled holes | A few dome holes (0 if good bone quality)—none in the chamfered area | Increased number—chamfer holes added |
| Stem cementation | Stem not cemented (only in rare cases with bad bone quality) | Stem cemented in 152 regardless of cyst size |
| Target stem shaft angle | Anatomic (first 100 hips) | 140° |
| Removal of cystic debris | Incomplete—curette only | Complete—high-speed burr |
In the hips with risk factors group, there were 632 hips in 551 patients; 323 were men (58.6%) and 228 (41.4%) were women. The mean age of the patients was 49.1 years; 302 metaphyseal stems were cemented and all acetabular components were uncemented. In this group, there were 381 hips implanted with the 5-mm shell and 251 hips with the thin 3.5-mm shell. All components were inserted using the posterior approach. Surgical details are described in a previous publication. The mean duration of the follow-up period was 6.7 years (2.4–13.8) for the ideal group and 8.5 years (2.4–13.8) for the group with risk factors. The patient demographics for each group are presented in Table 2 .
| Ideal | Risk Factors | P Value | |
|---|---|---|---|
| Male/female (%) | 97.8%/1.3% | 58.6%/41.4% | <.0001 |
| BMI | 28 (18.6–55.6) | 26.3 (17.3–46.4) | <.0001 |
| Age at operation (years) | 52.5 (24.9–83.9) | 49.1 (14.1–78.1) | <.0001 |
| Head size (mm) | 50.1 | 45.8 | <.0001 |
| Cup abduction | 43.8° (24.8–60.0) | 44.5° (16.2–71.5) | .1398 |
| Cup anteversion | 15.8° (2.0–41.8) | 18.8° (2.4–55.3) | <.0001 |
| CPR distance (mm) | 16.3 (7.0–27.1) | 13.5 (0.9–23.8) | <.0001 |
| Hips with femoral defects >1 cm | 0% | 38.3% | <.0001 |
All follow-up examinations were performed by the senior surgeon at the authors’ center or in one of the satellite clinics. These included calculation of Harris Hip Score, University of California, Los Angeles (UCLA) hip scores, and 12-Item Short Form Health Survey (SF-12) scores. Radiographic analysis included detection of possible osteolytic lesion and measurement of the position of the components (cup abduction and anteversion) using Einzel-Bild-Roentgen Analysis (EBRA) (University of Innsbruck, Austria). Using cup abduction, anteversion, and femoral head size, the contact patch to rim (CPR) distance was calculated for each hip, using a method previously described by Langton and colleagues.
Two-tailed, paired, Student t tests were used to compare preoperative and last follow-up clinical scores. Two sample, equal variance t tests were used to compare last follow-up clinical scores between groups. The comparative survivorship of the ideal hips group and hips with risk factors group was assessed using standard survivorship techniques (log-rank test for comparing Kaplan-Meier survivorship curves) to account for differences in follow-up time. A P value of less than .05 was deemed significant.
Results
All mean clinical outcome scores (UCLA pain, function, walking, and activity scores) improved significantly from pre- to postoperatively as did the SF-12 mental and physical scores ( P <.0001).
Clinical outcomes scores between ideal hips and hips with risk factors were compared and the results are in Table 3 . There was no difference in the UCLA pain score ( P = .790) but walking, function, and activity scores were higher in the ideal candidates ( P = .031, P = .006, and P <.0001, respectively). The proportion of hips with UCLA activity score of 9 or 10 was greater in the ideal group (34% in ideal group vs 22% in risk factors group, P <.0001). The ideal hips group also had significantly higher SF-12 mental ( P = .001) and physical scores ( P = .0055) and Harris Hip Scores ( P = .0001).
| UCLA Score | Ideal | Risk Factors | P Value |
|---|---|---|---|
| Pain | 9.3 (3–10) | 9 (2–10) | .790 |
| Walking | 9.7 (6–10) | 9.6 (3–10) | .031 |
| Function | 9.6 (4–10) | 9 (3–10) | .006 |
| Activity | 7.8 (3–10) | 7 (2–10) | <.0001 |
| SF-12 | |||
| Mental | 54.3 (21.0–64.1) | 52.6 (10.5–64.7) | <.0001 |
| Physical | 52.3 (24.1–62.4) | 49.0 (17.0–67.0) | .0055 |
| Harris hip score | 95 (56–100) | 92 (25–100) | .0001 |
Radiographic Analysis
There were 4 cases of small suspected osteolytic lesions observed in the ideal hips group (0.85%) and 8 in the risk factors group (1.26%). This difference was not significant ( P = .5186).
Ideal hips had a significantly lower average anteversion angle of 15.8° (average 2–41.8) compared with an average of 18.8° (range 2.4–55.3) for hips with risk factors ( P <.0001). There was no significant difference in the average abduction angle between ideal and hips with risk factors. The range was wider in the hips, however, with risk factors. For ideal hips, the average acetabular abduction angle was 43.8° (24.8°–60.0°) with 12 hips (2.6%) over 55°. Hips with risk factors had an average acetabular abduction angle of 44.5° (16.2°–71.5°) with 36 hips (5.7%) over 55°.
Ideal hips had significantly larger CPR distance (median 16.3 mm, range 7.0–27.1) compared with nonideal hips (median 13.5 mm, range 0.9–23.8) ( P <.0001).
Failures
Table 4 lists all the failures encountered in the ideal hips group and the hips with risk factors.
| Reason for Revision | Ideal Hips | Risk Factors Hips |
|---|---|---|
| Dislocation | 0 | 1 |
| Hematogenous sepsis | 1 | 1 |
| Femoral loosening | 1 | 24 |
| Acetabular loosening | 0 | 4 |
| Femoral neck fracture | 0 | 7 |
| Wear-related revisions | 0 | 4 |
| Other | 0 | 3 |
| Total | 2 | 44 |
In the ideal hips group, there were no failures due to acetabular loosening, wear, or adverse local tissue reactions. There were two conversions to THA; 1 was revised for late sepsis at 13.1 months postoperatively and 1 for femoral loosening 11.6 years postoperatively.
In the hips with risk factors, there were 44 revisions. Twenty-four were revised for femoral loosening, 4 for acetabular loosening, 7 for neck fracture, 4 for wear-related failure, 1 for dislocation, 1 for sepsis, and 3 for other causes (1 component size mismatch, 1 cup protrusion 3 days postoperatively, and 1 failure to achieve cup stability at surgery). There were 3 revisions for acetabular loosening in patients with thicker sockets and 1 revision in thin sockets. There were no revisions for metal hypersensitivity in either group assessed with the histologic diagnostic hallmark aseptic lymphocytic vasculitis-associated lesions).
Survivorship
At both 8 years and 10 years, the Kaplan-Meier survivorship was 99.7% (95% CI, 98.1%–99.9%) for ideal candidates, with 2 revisions at 13.1 months postoperatively (sepsis) and 11.6 years (femoral loosening). For hips with risk factors, the survivorship was 91.7% (95% CI, 88.4%–94.1%) at 8 years and 84.8% (95% CI, 78.6%–89.4%) at 10 years ( Fig. 3 ). This difference was significant (log rank test, P <.0001). Within hips operated with the second-generation surgical technique (hip #300 and beyond), hips with risk factors had a survivorship of 95.3% (95% CI, 90.8%–97.8%) at 8 years, whereas the survivorship of ideal hips was unchanged at 99.7% at 8 years (95% CI, 97.5%–100%). This difference ( Fig. 4 ) was still significant (log rank test, P = .0338). The survivorship improvement among hips with risk factors between first- and second-generations of surgical technique ( Fig. 5 ), however, was also significant (log rank test, P = .0231).
Results
All mean clinical outcome scores (UCLA pain, function, walking, and activity scores) improved significantly from pre- to postoperatively as did the SF-12 mental and physical scores ( P <.0001).
Clinical outcomes scores between ideal hips and hips with risk factors were compared and the results are in Table 3 . There was no difference in the UCLA pain score ( P = .790) but walking, function, and activity scores were higher in the ideal candidates ( P = .031, P = .006, and P <.0001, respectively). The proportion of hips with UCLA activity score of 9 or 10 was greater in the ideal group (34% in ideal group vs 22% in risk factors group, P <.0001). The ideal hips group also had significantly higher SF-12 mental ( P = .001) and physical scores ( P = .0055) and Harris Hip Scores ( P = .0001).
Related posts:
 Complications After Metal-on-Metal Hip Resurfacing Arthroplasty
Imaging of Metal-On-Metal Hip Resurfacing
The Effect of Patient Selection and Surgical Technique on the Results of Conserve® Plus Hip Resurfacing—3.5- to 14-Year Follow-up
Sporting Activity After Hip Resurfacing: Changes Over Time
Incidence and Significance of Femoral Neck Narrowing in the First 500 Conserve® Plus Series of Hip Resurfacing Cases: A Clinical and Histologic Study
The Future of Hip Resurfacing
Complications After Metal-on-Metal Hip Resurfacing Arthroplasty
Imaging of Metal-On-Metal Hip Resurfacing
The Effect of Patient Selection and Surgical Technique on the Results of Conserve® Plus Hip Resurfacing—3.5- to 14-Year Follow-up
Sporting Activity After Hip Resurfacing: Changes Over Time
Incidence and Significance of Femoral Neck Narrowing in the First 500 Conserve® Plus Series of Hip Resurfacing Cases: A Clinical and Histologic Study
The Future of Hip Resurfacing
Stay updated, free articles. Join our Telegram channel

Full access? Get Clinical Tree


