Abstract
Adolescents with cerebral palsy (CP) who walk or ambulate often have an abnormal clinical and radiological spinal profile during pubertal growth compared with adolescents of the same age without neuromotor impairments. Therefore, in the following study, we aimed to conduct a radiological assessment of static data on the lumbar-pelvic-femoral complex in ambulatory children with CP to compare these data with those of an asymptomatic population. The CP population was comprised of 119 children and the asymptomatic population was comprised of 652 children. The large format (30 × 90 cm) sagittal X-rays were taken while subjects were in a comfortable position in which knees and hips were in maximal extension. Analyses were performed using Optispine ® software to measure the parameters of an X-ray of the profile of the spine, pelvis and femurs. Comparing, the two populations, we found no difference in the shape parameter (pelvic incidence) but we did find significant differences in the positional parameters (pelvic tilt and sacral slope) of the pelvis. We found a difference in the curvature and orientation of lumbar lordosis as well as in the number of vertebrae involved in the kyphosis and its orientation. There was also a significant difference in the C7 plumb line. We can say that the CP population is not structurally different from the control population, but that parameters become disturbed during growth. These disturbances should be identified and monitored so that changes can be detected early and progression can be prevented.
Résumé
La population des paralysés cérébraux (PC) marchant ou déambulant présente souvent un profil rachidien anormal sur le plan clinique par rapport à un adolescent de même âge sans atteinte neuromotrice. Nous avons donc voulu dans ce travail réaliser une évaluation radiologique des données statiques du complexe rachis-bassin-fémur chez l’enfant PC déambulant afin de les comparer avec les données d’une population asymptomatique. La population de paralysés cérébraux est composée de 119 enfants et la population asymptomatique de 652 enfants. Les radiographies du plan sagittal, en grand format (30 × 90 cm), sont réalisées debout en position confortable, genoux et hanches en extension maximale. Les analyses ont été faites à l’aide du logiciel Optispine ® pour mesurer les paramètres radiologiques de profil de l’ensemble colonne, bassin, fémurs. En comparant les deux populations, nous n’avons pas trouvé de différence pour le paramètre de forme (incidence pelvienne), en revanche une différence significative a été mise en évidence sur les paramètres de position (version pelvienne et pente sacrée) du bassin. En ce qui concerne la colonne, nous avons trouvé une différence pour l’angulation de la lordose et l’orientation de celle-ci, ainsi que pour le nombre de vertèbres incluses dans la cyphose et son orientation. Il existe également une différence significative au niveau de l’aplomb de C7. On peut retenir que la population PC n’est pas structurellement différente de la population témoin et que c’est la croissance, dans le contexte pathologique, qui perturbe les paramètres. Il est nécessaire de s’en préoccuper et d’en rechercher les anomalies dès que possible pour mieux en prévenir l’évolution.
1
English version
1.1
Introduction
Adolescents with cerebral palsy (CP) who walk or ambulate often have an abnormal clinical and radiological spinal profile during pubertal growth compared with adolescents of the same age without neuromotor impairments . Therefore, in the following study, we aimed to conduct a radiological assessment of static data on the lumbar-pelvic-femoral complex in ambulatory children with CP to compare these data with those of an asymptomatic population. Do children with CP have a different spinal and pelvic profile? Are the observed abnormalities the result of abnormal pelvic bone growth due to musculotendinous retraction or muscular hypertonia above and below the pelvis?
CP is defined as a group of motor and/or postural disorders. These disorders are permanent, but their clinical manifestations, which are due to a condition, lesion or non-progressive abnormality in an immature or developing brain, may change over time . This definition is similar to those provided by Ingram , Bax and Rosenbaum . The term “cerebral palsy” therefore applies to all children and adults with motor deficiencies related to non-evolutive cerebral lesions, regardless of the intellectual capacity of these adults and children or the aetiology of the cerebral lesions.
1.2
Materials and methods
1.2.1
First group: control population
The control population was comprised of 652 asymptomatic children (age: 12.2 ± 3.1 years) taking part in an international, multicentre study (Canada, USA, France) on the X-ray parameters of a profile of the pelvis and spine. The first 180 subjects were analysed in an initial study , 161 patients were added in a second study and we added 311 patients in this study. This makes a total of 652 patients in our healthy population. This population was 42% male and 57% female (1% missing data).
1.2.2
Second group: cerebral palsy (CP) population
The CP population was comprised of 119 children (age: 11.9 years ± 4.2) and included 17 hemiplegic children and 102 diplegic children being followed at the Centre médico-chirurgical des Massues in Lyon, France. This population was 59% male and 41% female.
For the CP group, X-rays were not performed specifically for this study since such testing is part complete examinations they undergo during visits throughout a their growth period. For both study groups, we have sagittal X-rays in large format (30 × 90 cm) or digital format. These X-rays were taken in a comfortable standing position with hips and knees in full extension, elbows bent and hands at shoulder level, as recommended by Faro et al. in 2004 and Horton et al. in 2005 to minimise postural changes in the sagittal plane.
All of the analyses were performed by the same examiner using Optispine ® software to measure the parameters of the X-rays of the profile of the spine and pelvis. The measurement technique was described in different publications . The intra- and inter-observer variability for these measurements is 1° with intraclass correlation coefficients of 0.93 to 0.99, as was demonstrated by Berthonnaud et al. in 2005 .
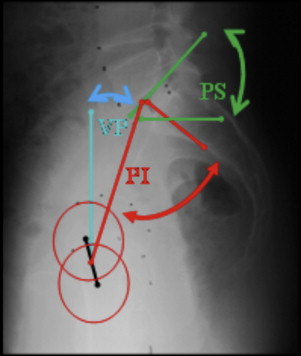
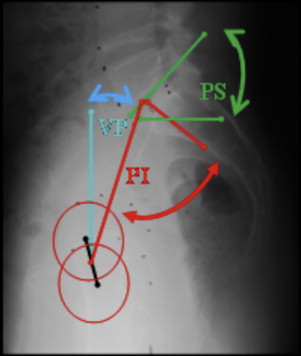
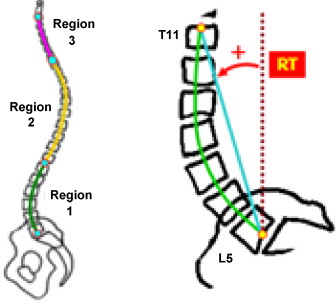
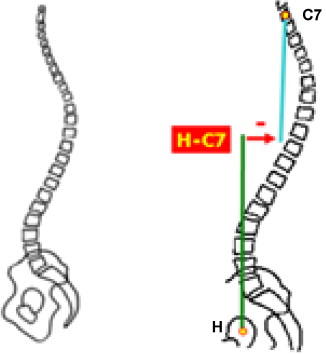
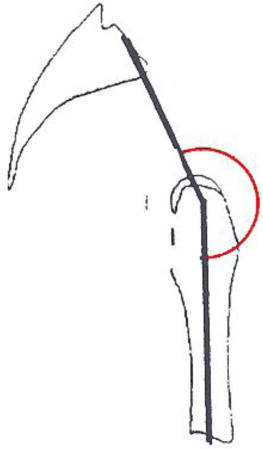
The parameters measured were: pelvic parameters , including pelvic incidence (PI), pelvic tilt (PT) and sacral slope (SS) ( Fig. 1 ), the parameters of lumbar lordosis (LL) and thoracic kyphosis (curvature, number of vertebrae involved in the curvature and orientation with respect to vertical [ Fig. 2 ]), C7 plumb line ( Fig. 3 ) and pelvic-femoral angle (PFA) ( Fig. 4 ).
The statistical analysis was performed using XL Stat (Addinsoft). A Student’s t test was used to compare means and a Pearson’s Chi 2 test was used for the correlations. The selected significance level was 0.05.
1.3
Results
1.3.1
Asymptomatic adolescents and children
1.3.1.1
Descriptive statistics
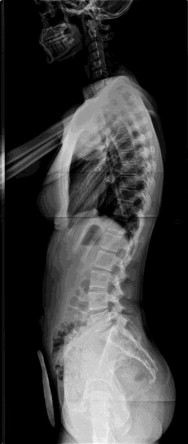
These are the results for the 652 asymptomatic adolescents and children ( Table 1 and Fig. 5 ).
| Asymptomatic | Cerebral palsy patients | |||
|---|---|---|---|---|
| Parameter | Mean | Standard deviation | Mean | Standard deviation |
| Patient | ||||
| Age | 12.2 | 3.1 | 11.9 | 4.2 |
| Pelvic parameters | ||||
| PI | 46.0 | 10.9 | 44.8 | 10.6 |
| PT | 7.1 | 8.1 | 0.3 | 12.5 |
| SS | 38.8 | 7.6 | 44.6 | 10.7 |
| PFA | 166.7 | 8.9 | ||
| Lumbar lordosis | ||||
| Curvature | 44.7 | 12.7 | 40.6 | 14.6 |
| Number of vertebrae | 5.0 | 1.2 | 5.1 | 1.5 |
| Orientation | –6.2 | 5.5 | –0.0 | 6.8 |
| Kyphosis | ||||
| Curvature | 44.8 | 10.6 | 45.0 | 11.6 |
| Number of vertebrae | 11.6 | 1.5 | 10.8 | 2.1 |
| Orientation | –4.1 | 5.4 | 3.4 | 7.8 |
| Cervical lordosis | ||||
| Curvature | 25.7 | 14.5 | ||
| Number of vertebrae | 5.7 | 1.6 | ||
| Orientation | 19.9 | 8.9 | ||
| Balance | ||||
| C7 plumb line | –28.5 | 41.3 | 35.1 | 47.6 |
1.3.2
Cerebral palsy adolescents and children
1.3.2.1
Descriptive statistics
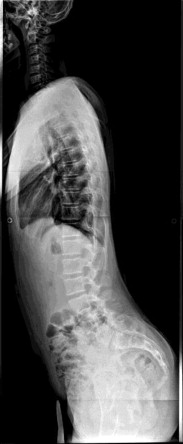
These are the results for 119 CP adolescents and children ( Table 1 and Fig. 6 ).
1.3.2.2
Correlations
1.3.2.2.1
Correlations with age
There is a correlation between:
- •
the age of a patient and the patient’s PI. The older the patient, the greater the PI;
- •
the age of a patient and the patient’s SS. The older the patient, the greater the SS;
- •
the age of a patient and the patient’s LL curvature. The older the patient, the more serious the LL ( Table 2 ).
| Parameters | ρ | P value | P value asymptomatic population |
|---|---|---|---|
| PI/Age | 0.363 | < 0.0001 | < 0.0001 |
| PT/Age | 0.043 | < 0.643 | < 0.0001 |
| SS/Age | 0.310 | 0.001 | 0.158 |
| C7 plumb line/Age | 0.091 | < 0.330 | < 0.0001 |
| C1curv/Age | 0.363 | < 0.0001 | < 0.0001 |
1.3.2.2.2
Correlations with lordosis curvature
There is a correlation between:
- •
PI and LL curvature. The greater the PI, the greater the LL curvature;
- •
PT and LL curvature. The smaller the PT, the greater the LL curvature;
- •
SS and LL curvature. The greater the SS, the greater the LL curvature ( Table 3 ).
Table 3
Correlations with lordosis curvature in the cerebral palsy (CP) palsy population.
Parameters
ρ
P value
P value asymptomatic population
PI/C1curv.
0.346
< 0.0001
< 0.0001
PT/C1curv.
–0.367
< 0.0001
< 0.0001
SS/C1curv.
0.709
< 0.0001
< 0.0001
C7 plumb line/C1curve
–0.028
< 0.760
< 0.003
PI: pelvic incidence; PT: pelvic tilt; SS: sacral slope; PFA: pelvic-femoral angle.
The bold data indicate the level of significance P < 0.05.
1.3.2.2.3
Comparisons by gender
Girls with CP have more serious LL than boys with CP, and they have a wider PFA than boys ( Table 4 ).
| Parameter | Boys ( n = 70) | Girls ( n = 49) | P value | P value asymptomatic population |
|---|---|---|---|---|
| Age | 12.0 ± 4.1 years (4.0–20.0) | 11.7 ± 4.4 years (4.0–20.0) | 0.65 | 0.06 |
| PI | 45.2 ± 11.2° (19.0–68.1) | 44.3 ± 9.9° (26.1–67.1) | 0.67 | 0.46 |
| PT | 1.6 ± 13.4° (–25.0–36.8) | 44.3 ± 9.9° (–24.8–24.6) | 0.15 | 0.85 |
| SS | 43.6 ± 10.6° (18.4–71.7) | 46.1 ± 10.8° (20.7–67.6) | 0.21 | 0.39 |
| PFA | 165.2 ± 9.8° (135–182.7) | 168.9 ± 7.4° (148.7–182.1) | 0.03 | |
| C7 plumb line | 38.2 ± 45.6° (–70.2–154.6) | 30.8 ± 50.4° (–81.0–188.9) | 0.41 | 0.04 |
| Lumbar lordosis | 37.9 ± 13.9° (8.4–74.8) | 44.5 ± 14.8° (17.6–79.4) | 0.01 | 0.03 |
| Kyphosis | 43.7 ± 11.1° (19.6–71.9) | 47.0 ± 12.1° (24.2–75.2) | 0.12 | 0.74 |
1.3.2.2.4
Correlations with pelvic-femoral angle measurements
There is a correlation between the PR and PFA, between the SS and the PFA, and between the kyphosis curvature and the PFA ( Table 5 ).
| Parameters | ρ | P value |
|---|---|---|
| Age/PFA | 0.055 | 0.565 |
| PI/PFA | –0.053 | 0.581 |
| PT/PFA | –0.344 | 0.0002 |
| SS/PFA | 0.346 | 0.0002 |
| Plumb line C7/PFA | –0.070 | 0.466 |
| C1curv/PFA | 0.186 | 0.050 |
| C2curv/PFA | –0.269 | 0.004 |
1.3.3
Comparisons between the asymptomatic population and the cerebral palsy (CP) population
There is a significant difference between healthy children and CP children in terms of PT, SS, LL curvature, LL orientation, number of vertebrae involved in the kyphosis, kyphosis orientation and C7 plumb line ( Table 6 ).
| Parameter | Mean healthy | Mean cerebral palsy (CP) | Difference | t | P value |
|---|---|---|---|---|---|
| Age | 12.191 | 11.874 | 0.317 | 0.961 | 0.337 |
| PI | 45.972 | 44.842 | 1.130 | 1.044 | 0.297 |
| PT | 7.140 | 0.258 | 6.882 | 7.703 | < 0.0001 |
| SS | 38.832 | 44.584 | –5.751 | –7.059 | < 0.0001 |
| C1curv | 44.675 | 40.608 | 4.068 | 3.134 | 0.002 |
| C1Nb | 5.035 | 5.151 | –0.117 | –0.933 | 0.351 |
| C1RT | –6.224 | –0.043 | –6.181 | –10.840 | < 0.0001 |
| C2curv | 44.863 | 45.049 | –0.186 | –0.173 | 0.862 |
| C2Nb | 11.600 | 10.761 | 0.840 | 5.290 | < 0.0001 |
| C2RT | –4.061 | 3.427 | –7.488 | –12.920 | < 0.0001 |
| C7 plumb line | –28.471 | 35.118 | –63.589 | –15.026 | < 0.0001 |
1.4
Discussion
This study demonstrated that the shape of the pelvis in the CP population, characterised by the PI, is no different from the shape of the pelvis in the control population (46° vs. 44.8°). This confirms the results published by Bernard in 2007 . The standard deviation (10.9° vs. 10.6°) is similar in both populations. The extreme values for PI are further apart in the control population (from 22.6° to 87.4°) than in the CP population (from 19.0° to 68.0°). The CP population does not have a specific pelvic position since the PI is not statistically different between this population and the control population. Consequently, spinal curvatures adjacent to the pelvis should be harmonious and balanced, including during the growth period. Harmonious and balanced spinal curvatures are those that correlate with the PI . The greater the PI, the more pronounced the lordosis, and vice versa. In clinical practice, we regularly observe either curvature abnormalities (pronounced or diminished) or balance abnormalities (in general, the patients lean forward) or lumbar pain requiring special treatment.
Preventing the onset of these neuro-orthopaedic abnormalities in the spine and the lower limbs during the growth period (abnormalities secondary to growth, such as musculotendinous retraction, range of motion limitations and pain) while the initial lesion (primary abnormality, which can manifest as spasticity) is stable is crucial to avoiding what Gage refers to as lever arm disease . This is the poor positioning of the ground reaction force vector during walking, which during growth spurts, manifests as a progressive slumping when standing, structural bone abnormalities (tertiary abnormalities) and gradual ambulation loss.
These disturbances can be explained, in part at least, by the fact that the positional parameters of PT and SS (whereas PI = PT + SS) in the CP population are statistically different from those of the control population. The PT diminishes and the average pelvis is in the plumb line of the hips with a resultant SS that is greater than that of the control population. The PI of the CP population is comparable to that of the control population, but the parameters that comprise the PI differ in the two populations ( Table 6 ).
This study does not reveal the reason behind the observed differences: are they due to musculotendinous retraction on the hip flexors (right anterior iliopsoas) or a weakness in the hip extensors (gluteus maximus)? We can only state that these positional parameters of the pelvis are different from those of the control population but we cannot discern the moment during growth when these parameters changed. The Rodda and Graham study on the kinematic evolution of the pelvis by type of gait, correlated with the natural progression of the disease, is an initial dynamic approach to the effect of the pathology on the position of the pelvis.
The correlational study shows us that PI is correlated with age in both populations: the older the child, the greater the PI. For Mac-Thiong , based on a population of healthy children and adolescents, the PI stabilises starting at 11 years of age.
LL is less pronounced on average in the CP population than in the control population, although it increases with age in both populations. In the CP population (which was predominantly male in this study), LL was statistically more pronounced (i.e., similar to what was found in the control population) in girls than in boys, which was not the case in the control population. Why are CP boys hypolordotic? There is an observed gender-based differentiation in the CP population that is not found in the control population. Does the predominance of males in the CP population of this study explain the difference in LL observed between the control and CP populations?
Another element was analysed in this study: it was the severity of the LL and the number of vertebrae involved in the curvature. The SS was more pronounced in the CP population than in the control population. The LL was also expected to be more pronounced in the study population. However, the opposite was observed. This hypolordosis protects the patient from back pain secondary to excessive pressure on the posterior joints.
This relatively mild LL can be explained by the PFA: this angle provides the position of the femurs with respect to the pelvis, and in the healthy population, this angle is approximately 187° (since the femurs are vertical, i.e., 180° + the PT angle); in our CP population, this angle was only 167°, which indicates either that the PT may be low (which is the case in our study, but this is insufficient to be the sole explanation for the low PFA) or the femurs are not vertical (which is the case for most walking CP children) due to flexion contractures of the hips and knees. This hip flexion while in a standing position diminishes the extent of the LL and maintains the balance of the spinal column. It would be interesting to continue this study by separating the population that underwent surgery (psoas release, ischio-tibialis release and triple flexion gait correction) from the population that did not undergo surgery to evaluate the effect of the change in PFA on lordosis.
Another element can explain this hypolordosis: the anterior projection of the spine as measured in the study by the C7 plumb line. In the CP population, C7 leans forward to offset the flexion contractures of the hips and knees (secondary to musculotendinous retraction) observed following the measurement of the PFA. This C7 leaning preserves the standing position and balance. It would be interesting to watch how the spinal column (C7 plumb line) changes according to the age at which ambulation begins and the type of ambulation, i.e., with or without technical assistance.
This study raises questions, which should lead to further studies:
- •
how do the measurements of the different X-ray pelvic and spinal parameters vary with the functional status of the CP children (according to the Gross Motor Function Classification System [GMFCS])?;
- •
how do various therapies during the growth period preceding the X-rays influence these parameters?;
- •
how does the age at which ambulation begins influence these parameters?;
- •
the study of the correlation between functional signs (whether or not there is back pain) and the parameters when the X-rays were taken should be integrated.
1.5
Conclusion
The CP population does not present any significant differences in PI compared with the control population. However, the positional parameters of PT and SS change, and the pelvis tends to become anteverted (through a decrease in PT) with a resultant increase in SS.
In order to maintain balance while standing, there needs to be counterbalance either above (C7 tilting forward, lordosis regional tilt, or C1RT, close to zero) or below (hip contractures and decrease in PFA). At what precise moment does the SS become abnormal?
In general, the CP population is not structurally different from the control population. Therefore, it is during growth in a pathological context that parametric disturbances appear. Intervention is required as soon as possible to prevent these disturbances, but this requires awareness and knowing what to look for.
In general, the CP population is not structurally different from the control population; rather, it is during growth in a pathological context that parametric disturbances appear. These disturbances should be identified and monitored so that changes can be detected early and their progression can be prevented.
Disclosure of interest
The authors declare that they have no conflicts of interest concerning this article.
2
Version française
2.1
Introduction
La population des paralysés cérébraux (PC) marchant ou déambulant présente souvent lors de la période de croissance pubertaire un profil rachidien anormal tant sur le plan clinique que radiologique par rapport à un adolescent de même âge sans atteinte neuromotrice. Nous avons réalisé dans ce travail une évaluation radiologique des données statiques du complexe rachis-bassin-fémur chez l’enfant PC déambulant afin de les comparer avec les données d’une population asymptomatique. Les enfants PC ont-ils un profil rachidien et pelvien particulier ? Les anomalies constatées sont-elles dues à une croissance osseuse anormale du bassin, en lien ou non avec des rétractions musculo-tendineuses ou une hypertonie des muscles sous- et sus-pelviens ?
La PC est définie au sens de « cerebral palsy » (CP) des Anglo-Saxons comme un ensemble de troubles du mouvement et/ou de la posture et de la fonction motrice . Ces troubles sont permanents, mais peuvent avoir une expression clinique changeante dans le temps et sont dus à un désordre, une lésion ou une anomalie non progressive d’un cerveau en développement ou immature . Cette définition est proche de celles données par Ingram , par Bax et par Rosenbaum . Le terme de PC regroupe donc tous les enfants et adultes ayant une atteinte motrice en lien avec une atteinte cérébrale non évolutive, quelles que soient leurs capacités intellectuelles et l’étiologie de l’atteinte cérébrale.
2.2
Patients et méthode
2.2.1
Premier groupe : population témoin
La population témoin est constituée de 652 enfants asymptomatiques (âge : 12,2 ans ± 3,1) fait partie d’une étude multicentrique internationale (Canada, États-Unis, France) sur les paramètres radiologiques de profil de l’ensemble bassin colonne. Les 180 premiers sujets ont été analysés dans une première étude , 161 patients ont été ajoutés dans une deuxième étude et nous ajoutons ici 311 patients ce qui nous fait un total de 652 patients dans notre population saine. Cette population est composée de 42 % de garçons et 57 % de filles (1 % données manquantes).
2.2.2
Second groupe : population des paralysés cérébraux (PC)
La population PC est constituée de 119 enfants (âge : 11,9 ans ± 4,2) dont 17 hémiplégiques et 102 diplégiques, suivis au centre médico-chirurgical des Massues à Lyon. Cette population est composée de 59 % de garçons et 41 % de filles.
Pour le groupe PC, les radiographies n’ont pas été réalisées spécialement pour cette étude, puisqu’elles font partie de l’examen complet lors des consultations spécifiques au cours de la croissance. Pour les deux groupes étudiés, nous disposons de radiographies dans le plan sagittal, en grand format (30 × 90 cm) ou de radiographies numériques, réalisées en position debout confortable, hanches et genoux en extension maximale, coudes fléchis, mains à hauteur des clavicules comme recommandé par Faro et al. en 2004 et Horton et al. en 2005 pour minimiser les changements posturaux dans le plan sagittal.
Toutes les analyses ont été faites par le même examinateur à l’aide du logiciel Optispine ® pour mesurer les paramètres radiologiques de profil de la colonne et du bassin. La technique de mesure a été décrite dans différentes publications . La variabilité intra- et inter-observateur de ces mesures est de 1° avec des coefficients de corrélation intraclasse entre 0,93 et 0,99 comme l’ont montré Berthonnaud et al. en 2005 .
Les paramètres mesurés sont : les paramètres pelviens composés de l’incidence pelvienne (IP), la version pelvienne (VP) et la pente sacrée (PS) ( Fig. 1 ) ; les paramètres de la lordose lombaire (LL) et de la cyphose thoracique (angulation, nombre de vertèbres incluses dans la courbure et orientation par rapport à la verticale [RT], Fig. 2 ), l’aplomb de C7 ( Fig. 3 ) et l’angle pelvi-fémoral (APF) ( Fig. 4 ).

