Many stroke survivors have walking limitations. The results of gait training in individuals who have had strokes are characterized by large confidence intervals for mean differences in gait parameters. An individualized approach to therapy is needed, based on personalized gait pattern indicators and sensorimotor impairments. Three-dimensional gait analysis can help clinicians design the best locomotor training strategy for their patients, and can determine whether a patient is responding to the chosen intervention. Spatiotemporal parameters allow the characterization of the gait of hemiparetic patients but, used alone, they do not allow the cause of the deviations to be inferred.
Key points
- •
Analysis of the time-distance parameters in patients who have had strokes reveals that they walk more slowly than healthy age-matched subjects. Reduced gait speed is combined with deviations in stride and step length, and/or lateral foot placement.
- •
Motion analysis shows that the angular excursion profiles of lower extremity joints are similar to those of healthy individuals, but the amplitude of peak values is reduced in subjects who have had strokes.
- •
Kinetic measurements (including the analysis of ground reaction forces) shows that patients who have had strokes have an asymmetric gait pattern and a decrease in peak moments and powers on the hemiparetic side. The hip flexors contribute more than the plantarflexors to energy generation while walking, contrary to what is observed in healthy individuals walking at self-selected speed.
Introduction
Stroke remains a major public health problem in many countries, afflicting nearly 15 million people worldwide each year (World Health Organization; http://www.strokecenter.org/patients/about-stroke/stroke-statistics/ ). Of this number, 5 million die and another 5 million are permanently disabled. Although the magnitude of the health care resources used to rehabilitate stroke survivors is considerable, many stroke victims continue to live with significant locomotor impairments. Moreover, the successful recovery of gait after stroke continues to be a day-to-day challenge for patients and for rehabilitation specialists.
The effects of gait training in individuals who have had strokes are characterized by large confidence intervals for mean differences in gait parameters at the end of training. This variable response to training has been attributed to the heterogeneity of the participants, as well as to the variability in the response to a given intervention. Moreover, although gait patterns are generally asymmetrical, large between-individual gait pattern differences exist, suggesting the need for a more individualized approach to therapy based on personalized gait pattern indicators and sensorimotor impairments.
Physicians and clinicians trained to care for patients with central neurologic conditions frequently carry out an observational gait assessment to characterize their patients’ specific gait dysfunctions in the context of routine clinical practice. The use of the naked eye or video images for gait analysis provides useful information to guide locomotor training. Many visual gait analysis rating scales, such as the Rancho Los Amigos System, the Wisconsin Gait Scale (WGS), the Gait Assessment and Intervention Tool (GAIT), and the Rivermead Visual Gait Assessment (RVGA), enable clinicians to describe pathologic gait deviations by body segments. However, as mentioned in a previous publication, the problem with observational gait assessment is its subjectivity and the lack of information on its psychometric properties (validity, reliability, responsiveness, and specificity). There needs to be more studies such as the one published by McGinley and colleagues (2006) to determine a reasonable threshold of visual detection, and to demonstrate the clinicians’ ability to accurately judge gait deviations in real-time observations. These investigators showed that, in a clearly defined task and with a single parameter to judge, such as push-off of the plantarflexors, physical therapists were able to rate the gait deviation accurately.
A three-dimensional (3D) gait laboratory designed for performing a complete biomechanical gait analysis (including spatiotemporal measurements, kinematics, kinetics, and electromyographic data) allows the quantification of the locomotor pattern of a person with neurologic impairments after stroke. The analysis identifies gait deficits and adaptive strategies, which, when combined with a neurologic assessment, can guide clinicians toward the causes of deviations and help them design the best and most effective locomotor training strategy for their patients. In addition, gait analysis allows the documentation of changes in relative effort, balance, and gait parameter variability (repeatability). Further, when used during a gait training session, this laboratory assessment can determine whether a patient is responding to the chosen intervention. Instrumented gait analysis remains the gold standard for gait assessment, although it can be argued that a complete biomechanical gait analysis with electromyography requires expensive equipment, time, and qualified personnel to prepare patients for the assessment, and to collect and interpret the data.
This article summarizes the process of gait analysis and the most important gait parameters and deviations in individuals who have had strokes, with specific emphasis on the effects of gait speed and the importance of ground reaction forces (GRFs).
Spatiotemporal Parameters
In the clinic, in the absence of appropriate equipment, it is difficult to measure the duration of each phase of the gait cycle, and to calculate which proportion of the cycle they represent. The use of instrumented surfaces, or sensors under the patient’s feet, allows the capture of spatiotemporal parameters. The stride characteristics are recorded with 3 sensors located on the sole of the subject’s shoe (heel, metatarsal heads, and big toe). The spatiotemporal parameters of gait can also be measured using a pressure-sensitive mat, such as the GAITRite mat (CIR Systems, Clifton, NJ). The GAITRite mat is a surface that contains a grid of sensors. The system records footfalls and also the time of activation/deactivation in relation to the location of activated sensors. Data are sampled and stored on a computer that calculates spatial and temporal parameters using dedicated software. The output from the GAITRite software is exported as a text file for further calculations. Gait symmetry measures (temporal and spatial) are calculated as ratios of the spatiotemporal values from the left and right lower limbs. In addition to symmetry parameters, gait velocity, cadence, stride length, step length, cycle time, and single and double support times can be measured. The concurrent validity and reliability of the GAITRite system has been established.
The spontaneous gait speed of hemiparetic individuals is decreased, and is usually between 0.08 m/s and 1.05 m/s, compared with an average gait speed of 1.0 to 1.5 m/s in healthy individuals. Gait speed is influenced by stride length and cadence (number of steps/min). In healthy individuals, the spontaneous cadence is 115 steps/min on average, whereas it can be markedly decreased after a stroke: between 27.9 and 47.2 steps/min according to Bohannon and 57 steps/min according to Brandstater and colleagues, even in subjects with good motor recovery. Step and stride length are also reduced after a stroke, and this further contributes to decreasing walking speed. Balasubramanian and colleagues showed that step length asymmetry is closely linked to a lack of propulsive force generation on the paretic side. In a recent study, the same investigators showed that not only front and back foot placement but also lateral foot placement relative to the pelvis in hemiparetic subjects differs from that of healthy subjects, depending on the walking speed. The results show that lateral asymmetry (the difference in foot position relative to the pelvis) is significantly related to the percentage of body weight supported by the paretic limb. The investigators recommend quantifying foot position relative to the pelvis in addition to step length.
Changes in walking speed, cadence, and step (or stride) length are associated with changes in the durations and proportions of the phases of the gait cycle. At spontaneous walking speed, a normal gait cycle, corresponding with the period between two successive strikes of the same foot (most often heel strike), has an average duration of 0.8 to 1.2 seconds. In a hemiparetic individual walking more slowly, the cycle time increases to 1.8 to 2.22 seconds. To analyze gait and allow a comparison between individuals, the gait cycle must be normalized between 0% and 100% and divided into a stance phase and a swing phase. In the healthy adult, the stance phase represents 60% to 62% of the gait cycle on average, whereas the swing phase represents 38% to 40%. The stance phase is subdivided into a single support phase (about 40% of the gait cycle) and two double support phases (20%–24% of the gait cycle). The swing phase is subdivided into an initial, middle, and final phase. The stance phase in stroke survivors represents a greater part of the gait cycle compared with healthy individuals, both on the nonparetic side and on the paretic side, but the difference is more pronounced on the paretic side. In addition, the double support time is increased in hemiparetic individuals, representing 52 ± 17% of the gait cycle according to Roth and colleagues. These changes are caused in part by the decrease in walking speed. The swing phase seems to be most affected (reduced) in individuals with slow or very slow walking speed (0.72–2.18 seconds or 25%–54% of the gait cycle, compared with 0.4 seconds and 40% of the gait cycle in healthy individuals). Some investigators report that the swing phase is a determining phase of the gait cycle, and that its improvement leads to improved gait symmetry. However, spatiotemporal parameters allow the characterization of the gait of hemiparetic individuals, but, used alone, they do not allow the cause of the observed deviations to be inferred.
Kinematics
Kinematics describe body motions independently from the internal and external forces that cause them. They are described in the 3 planes of space and include linear and angular motions, velocities, and accelerations. 3D kinematic gait parameters can be measured with passive systems such as the Vicon system (Vicon, Oxford, UK) or the ELITE optoelectronic system (BTS spa, Milano, Italy) with 6 cameras. This technology uses markers that reflect projected light (retroreflective markers). After the subjects have been instrumented with the markers (usually clusters of markers attached to rigid bodies on standard and specific anatomic landmarks), 3D gait data are collected with infrared cameras. Then the spatial location of each circular reflective marker placed on the skin is determined by identifying (automatically or by user input) the bright spots on the screen that belong to each physical marker. Reflective marker systems require time to digitize the x, y, and z coordinates and mathematical models to reconstruct the coordinates of the markers. The markers have to be identified and potential merging of markers in various camera views places limitations on how close to each other the markers may be placed. Passive markers are less constraining for the subject (the subject is not tethered to wires), but they require a more intelligent data processing system. Other advantages of passive markers include ease of attachment to the body segments, which allows the subject under analysis maximum freedom of movement, and, at least theoretically, the use of a potentially unlimited number of markers. In general, passive marker systems require the collection of calibration data before recording the position of the markers placed on a given segment. In contrast, active marker systems ( Fig. 1 ), such as the Optotrak system (Northern Digital Inc, Waterloo, Ontario, Canada), use light-emitting diode (LED) markers that are pulsed sequentially, so the system automatically knows the identification of each marker. Only 1 LED is turned on at any instant in time. The cameras then uniquely identify the instant spatial location of that marker. The marker coordinates are automatically identified. The main advantage of active markers is their easier labeling. Marker tracking is not a problem and merging markers cannot occur with these systems, thus the markers can be placed close to each other. Overall, active marker systems exhibit excellent accuracy. Drawbacks include that they require wires to be attached to each marker, and that there is no video image to concomitantly view or record the subject’s movements (see Fig. 1 ).
The markers are placed on relevant body segments (feet, lower legs, thighs, pelvis), as shown in Fig. 1 . An anthropometric model is used to represent the subject’s characteristics. The proximal, distal, and largest circumference of each limb segment can be measured, along with the subject’s body weight, to model the segment geometry and the position of the segment’s center of mass and mass, based on anthropometric references such as those published by Winter. Inertia moments are also computed from the length, diameters, and mass of the limb segments. To obtain true 3D motion analysis, each group of 3 markers (which create a plane passing through the segment) should be continuously recorded (usually around 60 Hz) while the subject walks, and joint centers as well as angles (eg, Euler) must be defined. Kinematic data are filtered and software is used to calculate the relative angles (eg, Euler, Cardanic). The local x, y, and z axes correspond with the abduction-adduction, longitudinal rotation, and flexion-extension axes for the hip and knee joints, whereas at the ankle they corresponded with the eversion-inversion, transverse rotation, and dorsiflexion-plantarflexion axes, respectively.
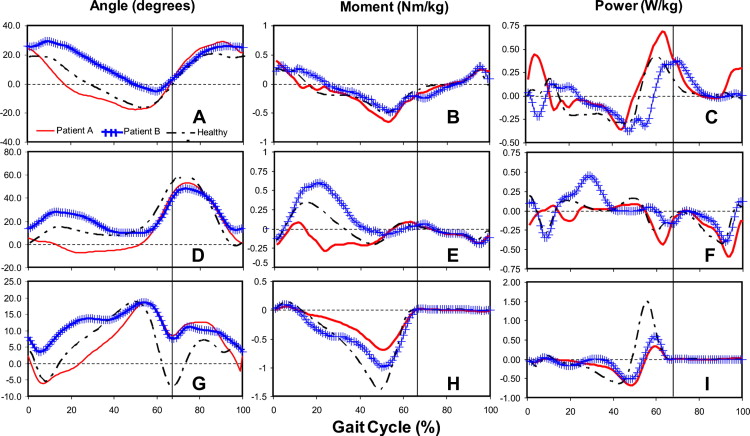
This article only discusses angular motions in the plane sagittal to the lower extremities. After a stroke, the angular excursion profiles for lower extremity joints are similar to those of healthy individuals. However, the occurrence and amplitude of peak values differ from the norms, and the difference is more noticeable as the walking speed deviates from that of healthy individuals, as shown in Fig. 2 . At the early stance phase, published studies report a flat foot strike, associated with increased knee flexion and decreased hip flexion. A decrease in plantarflexion and hip extension subsequently brings the knee into hyperextension. During the swing phase, in addition to decreased knee flexion, circumduction of the leg or exaggerated hip flexion allows adequate foot clearance. Kinematic changes are also observed on the intact side, with increased knee flexion during swing phase and decreased knee extension during stance phase. However, these changes are less pronounced than those observed on the affected side. Kinematic values vary among individuals with hemiparesis, therefore the data should be analyzed with caution. It is therefore important to examine in detail the angular displacements in each patient, to assess deviations and to establish an individualized treatment plan.
Kinetics
Kinetics refer to the internal and external forces resulting in the specific movement pattern observed. Moments and powers are obtained from measurements of the GRFs, combined with kinematic data in an inverted dynamic model at each 1% interval of the gait cycle. During gait, the net moment of a joint equals the sum of the active moment produced by muscle contraction and the passive moment associated with the joint’s noncontractile structures (ie, capsule and connective tissues). Maximum values for moments and powers increase with walking speed. Similar to kinematic variables, the net positive moment and power of the hip, knee, and ankle on the affected side have a profile comparable with that of healthy individuals, but the amplitude is often decreased, as shown in Fig. 2 . At the hip, the energy generated by the extensors at the beginning of the gait cycle (H1) can be null, less or higher than that of healthy individuals (approximately 0.2 W/kg), depending on the study. The energy generation from the hip flexors (approximately 0.5 W/kg) remains present in hemiparetic individuals, but tends to decrease as the walking speed decreases. At the ankle, the net positive power (approximately 0.9 W/kg) generated by the concentric contraction of the plantarflexors during the push-off phase (A2) still contributes to energy generation, but to a lesser degree, as shown by Morita and colleagues. Moreover, the energy generation from the plantarflexors is absent in hemiparetic individuals who walk at a very low speed (≤0.25 m/s). Therefore, the hip flexors contribute more than the plantarflexors to energy generation while walking, contrary to what is observed in healthy individuals walking at self-selected speeds. On the nonaffected side, the same trends are observed; however, the net moment and power, although still less than normal values, are greater compared with the affected side. The ratio of the energy produced by muscles on the nonaffected side compared with the affected side is around 60:40, and remains similar at various degrees of walking capacity.
Researchers recently estimated the level of effort for key muscle groups on both sides, in healthy and hemiparetic individuals. Subjects in the stroke group showed a greater level of effort (45%–78%) than able-bodied subjects matched for cadence (24%–63%). For both groups, the level of effort was similar between sides and increased with cadence. At self-selected cadence, the plantarflexors showed greater relative effort values, whereas, at maximal cadence, levels of effort for all muscles were equivalent. The investigators concluded that, for a similar cadence, the levels of effort of hemiparetic individuals were greater than those of able-bodied individuals. As with able-bodied individuals, community-walker hemiparetic individuals had effort values that increased significantly with speed, with the hip muscles presenting the largest gain. However, the effort values of these hemiparetic individuals were greater than those of healthy individuals matched for cadence. These results also suggested that the hemiparetic participants spontaneously decreased their self-selected speed to keep their level of effort similar to that observed in able-bodied individuals walking at self-selected speed.
GRFs and Walking Speed
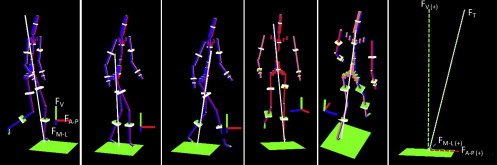
The GRF is represented by 3 components that correspond with the forces the human body exerts to the ground during walking ( Fig. 3 ). In the analysis of gait pattern, the main task is the forward propulsion of the body’s center of mass (COM), which can be analyzed by capturing the anterior-posterior force during walking. The vertical GRF (V-GRF) is related to the weight support of the acting/moving subject. There is also a mediolateral force. The mediolateral acceleration of the COM is equal to the total mediolateral GRF (ML-GRF) divided by the body mass. These 3 forces are all related to stance duration and body mass. The GRF analysis has been used as a method to assess the gait pattern of stroke survivors.
Related posts:

Stay updated, free articles. Join our Telegram channel

Full access? Get Clinical Tree


