Abstract
Objectives
Report the use of an optical technique for individual monitoring of the sagittal morphology of the spine in an upright position while avoid irradiation.
Subjects and methods
The series consists of 15 asymptomatic subjects and 326 cases with spinal disorders. Sagittal analysis is expressed by the global trunk tilt (GTT), the intensity of the curves and their level of inflection.
Results
The confidence interval is 2 to 3° and 3 to 6 mm according to the parameters. A significant correlation was observed for the global axis measured by optical or radiological techniques. Variations in intensity and proportion of thoracic and lumbar sagittal curves were observed according to the disease, as well as their evolution over a period of 5 to 30 months. Various “strategies” of adaptation have been observed during repeated examinations.
Discussion
This non-radiating technique allows to be repeated after initial X-rays, for regular monitoring of a disturbance or a therapeutic effect. Its understandable imaging allows the patient to be aware of his situation.
Conclusion
This optical technique is reliable and safe for monitoring the sagittal balance while helping further therapeutic target.
Résumé
Objectifs
Rapporter l’utilisation d’une technique optique pour le suivi individualisé de la morphologie sagittale du rachis en position debout tout en évitant l’irradiation radiologique.
Sujets et méthode
La série se compose de 15 sujets asymptomatiques et 326 cas présentant une pathologie rachidienne. L’analyse sagittale est exprimée par l’axe global du tronc (AGT), l’intensité des courbures et leur niveau d’inflexion.
Résultats
L’intervalle de confiance est de 2 à 3° et de 3 à 6 mm selon les paramètres. Une corrélation significative a été observée pour l’axe global mesuré par la technique optique et sur les radiographies. Des variations en intensité et en proportion des courbures sagittales thoraciques et lombaires ont été observées selon les pathologies, ainsi que leurs évolutions sur une période de cinq à 30 mois. Divers « stratégies » d’adaptation ont été mises en évidence lors d’examens répétés.
Discussion
L’aspect non irradiant de la technique en permet la répétition, après une radiographie initiale, pour un contrôle régulier ou l’évaluation d’une thérapeutique. Son imagerie compréhensible permet au patient de prendre conscience de sa situation.
Conclusion
Cette technique optique est utilisable sans risque pour un suivi de l’équilibre sagittal tout en aidant à la poursuite d’un objectif thérapeutique.
1
English version
1.1
Introduction
Nowadays, the analysis of the sagittal balance of the spine is described by the relations between several pelvic and spinal parameters measured on plain lateral X-rays in upright position . It results a potentially iatrogenic significant ionising radiation, which is hazardous to the long term healthy, moreover if they are often repeated.
On the other hand, optical techniques were proposed to appraise the back shape in case of spinal deformities to reduce the ionising radiation and so, the risk of cancer . We propose here the use of such optical technique for the analysis of the sagittal balance in various spinal disorders.
1.2
Material and method
1.2.1
The optical system
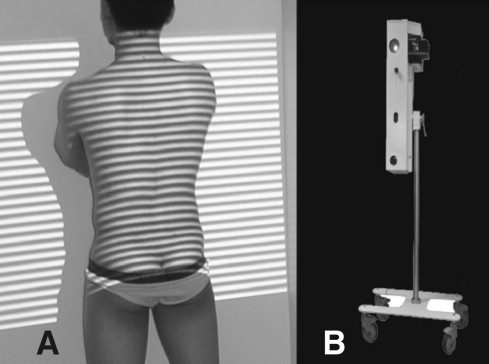
The system Biomod L ® (AXS Ingenierie, Bordeaux-Mérignac, France) was an optical process assessing the 3D geometry of the back by the analysis of the deformation induced by the relief on successive systems of projected luminous bands (Moiré fringes) ( Fig. 1 ).
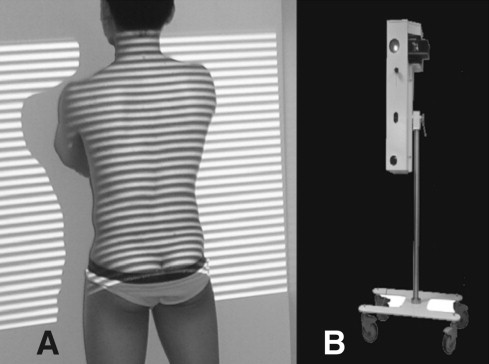
The acquisition time was five seconds. Possible moving of the subject was automatically detected and the data rejected . Four cutaneous landmarks were positioned manually: one on the C7 posterior process, one in each two small cavities of the triangle of Michaelis and one plumb to the inter-gluteal cleft.
The subject was in upright position, watching a point at horizontal of its glance, the upper limbs in 30° anterior flexion of the shoulders, the hands on a support. This position was selected because reported reliable, reproducible and identical for the optical and radiographic procedures.
The sagittal plane was evaluated according to the sagittal projection of the cutaneous “Spinal Processes Line” (SPL). This allowed a three-dimensional analysis and minimized the artefact of a possible adiposity.
1.2.2
Parameters provided by the optical technique
The parameters provided by the optical technique are:
- •
the “Lordosis” (L) and “Kyphosis” (K) curves (in degrees): the angle between the normal to the lumbar and thoracic curves at their extremities and the corresponding inflection point on the SPL ( Fig. 2 A );
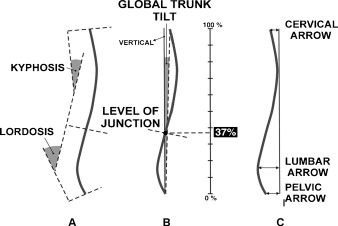
Fig. 2
The optical parameters.
A. Kyphosis and lordosis of the sagittal projection of the spinous processes line. B. Global trunk tilt (GTT) and level of the junction point between the lordosis and kyphosis (LJ). C. The “Sagittal arrows”: cervical, thoracic, lumbar and pelvic.
- •
the “Global trunk tilt” (expressed in degrees) (GTT): the sagittal angle between the line connecting the upper and lower points of the SPL and the vertical ( Fig. 2 B);
- •
the “Level of the junction point between the lordosis and kyphosis” (LJ): expressed as a percentage of the total height of the spine from the bottom ( Fig. 2 B);
- •
the “Sagittal arrows” (similarly to the clinical measurements): the distances (in millimetres, the zero being the most posterior point of the SPL) between the vertical tangential to the SPL toward the apical points of respectively the “cervical (Carr), thoracic (TArr), lumbar (LArr) and pelvic (PArr) sagittal arrows” of the SPL ( Fig. 2 C);
- •
the “sagittal profiles”: they were defined according to the LJ of the sagittal curves and their respective intensity. LJ allowed defining three classes of profiles: between 30 and 40% the types A, more proximal the types B, more caudal the types C. For each types, the relative intensity of the curves characterized sub-types. For each subject, an anterior (positive) or posterior (negative) GTT was reported as abnormal if more than 4° ( Fig. 3 ).
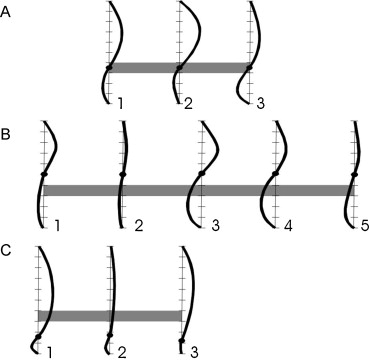
Fig. 3
The types of profiles in morphometry according to the level of the junction between the sagittal curves and their intensity.
1.2.3
Radiographic parameters
When lateral plain radiographs including spine and pelvis in upright position were available (87 cases), the values of the classical parameters were measured ( Fig. 4 ):
- •
the sagittal global axis (axis C7S1): the angle between the vertical in the middle of the “upper plate of the first sacral vertebra” (S1) and the line linking this point and C7;
- •
the “Pelvic Incidence” (PI): value of the angle between the line perpendicular to S1 at its midpoint and the line connecting this point to the middle axis of the femoral heads;
- •
the “Sacral slope” (SS): value of the angle between S1 and a horizontal line;
- •
the “Lordosis Angle” (LA): the value of the angle between the sacral plate and the more backward tilted plate of another lumbar or thoracic vertebra (in our series always L1 or T12);
- •
the “Kyphotic Angle” (KA): the value of the angle between the more backward tilted plate used for “LA” measurement and the more forward tilted upper vertebral plate.
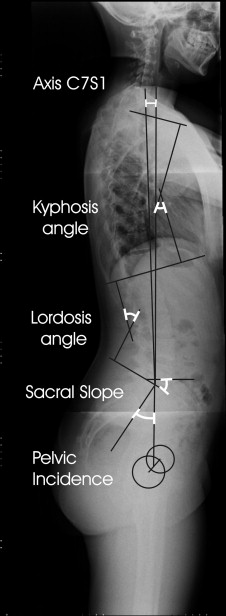
These angles have been thoroughly described several years ago in the orthopedic literature for the analysis of the sagittal balance of the spine . The anatomical parameter “Pelvic Incidence” was demonstrated to be the “key parameter”. A strict relationship was described between this anatomical parameter PI and the sagittal tilt of the sacral plate (the Sacral slope “SS”), and between this “SS” and the amount of lumbar lordosis (LA) :
For each case, the observed values of the sacral slope “SS” and the lordosis angle “LA” were compared to the theoretically optimal values required by these two equations for a harmonious sagittal balance . The differences between the observed and theoretical values were reported as:
- •
the “Difference in Sacral slope” (Δ SS): difference between the observed and theoretical values of Sacral Slope;
- •
the “Differences in Lordosis angle”: difference between the observed and theoretical values of Lordosis angle according to the observed Sacral Slope (Δ Lord) and to the optimal Sacral Slope for the Pelvic Incidence value (Δ Lord-optimal).
Observed curves were always insufficient, never excessive.
1.2.4
Populations
The data of 341 subjects were considered: 15 “asymptomatic subjects” (ASS) and 326 cases with various spinal disorders such as “Scoliosis” (SCO), “Kyphosis” (KYP), “After-Effect of Fracture” (AEF), “Spinal Pain” (SPN) ( Table 1 ). The chairman of our Ethics Committee attested that the data collection of all included patients and healthy subjects was in agreement with the recommendation of the Institutional Review board of the institution.
| Normal n = 15 | Spinal pain n = 110 | Kyphosis n = 33 | Fractures n = 31 | Scoliosis n = 152 | |||||||||||
|---|---|---|---|---|---|---|---|---|---|---|---|---|---|---|---|
| M 7 W 8 | M 42 W 68 | M 17 W 16 | M 12 W 19 | M 33 W 119 | |||||||||||
| Mean | SD | Min max | Mean | SD | Min max | Mean | SD | Min max | Mean | SD | Min max | Mean | SD | Min max | |
| Age | 41 | 10 | 22 59 | 42 | 20 | 11 66 | 25 | 17 | 10 71 | 46 | 17 | 23 79 | 20 | 13 | 7 86 |
| Height | 168 | 8 | 155 183 | 167 | 10 | 137 88 | 163 | 19 | 102 184 | 168 | 10 | 150 185 | 162 | 11 | 130 190 |
| Weight | 62 | 14 | 45 4 | 71 | 14 | 46 108 | 62 | 12 | 39 80 | 72 | 14 | 54 100 | 55 | 14 | 24 104 |
| BMI | 22 | 3 | 17 27 | 26 | 4 | 17 33 | 24 | 5 | 16 37 | 26 | 5 | 20 35 | 21 | 4 | 14 37 |
| Angles | |||||||||||||||
| Global tilting (°) | 2 | 2 | –1 4 | 6 | 5 | –1 35 | 3 | 5 | –5 11 | 5 | 4 | –1 10 | 2 | 4 | –11 14 |
| Level of inflexion (%) | 41 | 10 | 28 57 | 30 | 14 | 0 54 | 25 | 12 | 0 39 | 30 | 13 | 11 50 | 40 | 17 | 0 100 |
| Kyphosis (°) | 36 | 10 | 19 51 | 38 | 11 | 20 62 | 48 | 6 | 38 55 | 30 | 15 | 19 40 | 33 | 15 | 0 87 |
| Lordosis (°) | 44 | 12 | 30 59 | 34 | 17 | 0 68 | 46 | 16 | 19 68 | 25 | 12 | 16 33 | 38 | 14 | 0 62 |
| Arrows | |||||||||||||||
| Cervical (mm) | 44 | 24 | 6 102 | 59 | 29 | 5 126 | 67 | 28 | 21 104 | 61 | 26 | 24 108 | 40 | 24 | 3 126 |
| Thoracic (mm) | 2 | 2 | 0 6 | 5 | 10 | –5 45 | 0 | 1 | –3 0 | 4 | 12 | –5 38 | 4 | 8 | –5 42 |
| Lumbar (mm) | 52 | 21 | 26 94 | 38 | 18 | 0 89 | 63 | 25 | 32 102 | 40 | 15 | 23 70 | 44 | 21 | 5 130 |
| Pelvic (mm) | 2 | 6 | 0 9 | 16 | 17 | 0 65 | 46 | 27 | 12 94 | 20 | 21 | 0 56 | 22 | 23 | 0 112 |
| X-Rays | |||||||||||||||
| Incidence (°) | – | – | – | 47 | 8 | 32 70 | 51 | 7 | 40 61 | 49 | 9 | 41 68 | 52 | 7 | 36 67 |
| Sacral Slope (°) | – | – | – | 30 | 10 | 12 61 | 33 | 10 | 21 49 | 39 | 11 | 20 57 | 36 | 9 | 17 55 |
| Kyphosis (°) | – | – | – | 51 | 15 | 22 88 | 74 | 11 | 58 88 | 50 | 13 | 30 70 | 45 | 14 | 16 89 |
| Lordosis (°) | – | – | – | 45 | 12 | 24 70 | 60 | 13 | 41 76 | 56 | 13 | 42 76 | 56 | 11 | 37 80 |
| Axis C7 S1 (°) | – | – | – | 4 | 3 | –5 11 | 2 | 4 | –8 6 | 4 | 2 | 1 7 | 0 | 4 | –8 9 |
| Δ SS (°) | – | – | – | 9 | 8 | –15 23 | 8 | 7 | –3 16 | 0 | 12 | –22 18 | 5 | 6 | –11 21 |
| Δ lord (°) | – | – | – | –9 | 12 | –56 6 | 3 | 11 | –11 16 | –8 | 8 | –17 5 | –6 | 8 | –22 26 |
| Δ lord-optimal (°) | – | – | – | –19 | 11 | –39 3 | –5 | 12 | –25 10 | –8 | 14 | –29 15 | –11 | 10 | –35 19 |
1.3
Results
The anthropometric data are reported in Table 1 . The groups “Spinal Pain” and “Fracture” were significantly older than the groups “Scoliosis” and “Kyphosis” ( P > 0.001). Moreover, at similar range of age, the “Kyphosis” cases were significantly more obese than the “Scoliosis” cases ( P > 0.001).
The reliability of the measurements was evaluated on two subjects from the asymptomatic group: a 53-year-old-man without pathology and a 53-year-old woman with a scoliotic attitude by 1.5 cm asymmetry of the lower limbs because of complicated total hip arthroplasty. Five observers carried out an examination for each (inter-observer variability or reproducibility) and an observer carried out 15 examinations for both (intra-observer variability or repeatability). Each time, all the cutaneous markers were totally removed and then replaced manually one by one. The confidence interval of the measures was evaluated as 2 to 3° for the angular values, 3 to 6 mm for the arrows ( Table 2 ).
| Variability | Inter-observer “Reproducicibility” | Intra-observer “Repeatability” | Asymptomatic cases n = 15 | |
|---|---|---|---|---|
| Mean | SD | |||
| Global tilting (°) | 1 | 1 | 2 | 2 |
| Level of inflexion (%) | 6 | 5 | 34 | 7 |
| Kyphosis (°) | 4 | 2 | 38 | 11 |
| Lordosis (°) | 3 | 2 | 44 | 12 |
| Cervical Arrow (mm) | 4 | 3 | 44 | 24 |
| Thoracic Arrow (mm) | 0 | 0 | 3 | 9 |
| Lumbar Arrow (mm) | 5 | 6 | 52 | 21 |
| Pelvic Arrow (mm) | 4 | 5 | 2 | 6 |
| A. | B. | |||
The values measured for the 15 asymptomatic subjects are reported in Table 2 B. Their scattering was much larger than the confidence interval of the measurements, testifying to the individual variability of the sagittal morphology already noted in previous radiological studies . On the other hand, the global trunk tilt “GTT” of these subjects was almost vertical, indicative of a “normal” attitude, as well as the level of inflection of the curves, which was at 30 to 40% of the total height.
The values of the optical and radiographic measurements of the 326 patients according to the clinical groups are reported in Table 1 . When several consecutive examinations were carried out during the evolution of a subject, only the initial one was reported.
1.3.1
Radiological parameters
The values of PI did not differ significantly between the clinical groups and were similar to the published data . The mean values of the Sacral Slope and of the sagittal curves were of poor interest as such, except the very marked kyphosis angle “KA” in the group “Kyphosis”. Only the relations between the pelvis and the sagittal spinal curves allowed an individualized evaluation. The values of ΔSS objectified a pelvic retroversion adjustment in the groups “Spinal Pain” and “Kyphosis”. Lordosis was significantly insufficient (Δ Lord significant) in each group, except for the cases of “Kyphosis” for which a compensatory increased lordosis was observed. The lumbar curves (Δ Lord-optimal) in the groups “Spinal Pain” and “Scoliosis” were significantly flattened according to the values adapted to the pelvic morphology.
1.3.2
Optical parameters
For the whole of cases for which simultaneous radiographies were available, a significant correlation ( r = 0.68, P < 0.001) was observed between the GTT evaluated optically and the radiographic axis C7S1. Nevertheless, no significant correlation was found between corresponding sagittal radiographic and optical parameters (L or LArr and LA, K or TArr and KA).
This global tilt “GTT” was significantly forwards in the groups “Spinal Pain” and “Fracture”, whereas it was vertical in the groups “Scoliosis” and “Kyphosis”, which were also younger. In the group “Kyphosis”, the kyphosis was very marked, the lordosis and the lumbar fleches were also important, testifying to a lumbar adjustment. The pelvic arrows “PArr” were also more important in the group “Kyphosis”, expressing a pelvic participation. Contrarily, the lordosis “L” was significantly flattened in the group “Fracture”, because at the same time of the localization of vertebral fracture (often at the thoraco-lumbar junction) and of the relative lumbar stiffness of the aging.
The repartition of the types of profiles according to the groups are reported in Table 3 for the whole population, in Table 4 for the scoliotic cases according to the topography of the frontal curves. For almost all the asymptomatic cases, the location of the level of junction of the sagittal curves “LJ” was between 30 and 40% of the height of the spine or slightly higher (by an obliteration of the lumbar lordosis, and sometimes of the thoracic kyphosis). The profiles of the cases of “Spinal Pain” frequently presented a decrease of the amount of lumbar lordosis (A2 with a marked kyphosis, B2) or in size (C3). The types with most important kyphosis were prevalent in the group “Kyphosis”, for some well balanced by an increased lordosis (B3), for other insufficiently (A2, C1, C3). The “Fracture” also presented an increase of kyphosis (A2, B3), a normal aspect (A1) or an obliteration of the curves (B2).
| Asymptomatic n = 15 | Spinal pain n = 110 | Kyphosis n = 33 | Fractures n = 31 | Scoliosis n = 152 | ||||||
|---|---|---|---|---|---|---|---|---|---|---|
| A1 | 7 | 16 | 4 | 8 | 27 | |||||
| A2 | 2 | A: 73% | 38 | A: 51% | 18 | A: 67% | 11 | A: 62% | 25 | A: 39% |
| A3 | 2 | 2 | – | – | 7 | |||||
| B1 | 1 | 6 | – | – | 17 | |||||
| B2 | 2 | 19 | – | 6 | 26 | |||||
| B3 | – | B: 27% | 6 | B: 35% | 2 | B: 6% | – | B: 19% | 14 | B: 55% |
| B4 | – | 5 | – | – | 11 | |||||
| B5 | 1 | 3 | – | – | 15 | |||||
| C1 | – | 5 | 5 | – | 2 | |||||
| C2 | – | C: 0% | – | C: 14% | – | C: 27% | – | C: 19% | – | C: 6% |
| C3 | – | 10 | 4 | 6 | 8 | |||||
| Attitudes n = 26 | Dubbles n = 22 | Thoracic n = 24 | Thoraco-lumbar n = 49 | Lumbar n = 31 | ||||||
|---|---|---|---|---|---|---|---|---|---|---|
| % ( n ) | % | % ( n ) | % | % ( n ) | % | % ( n ) | % | % ( n ) | % | |
| A1 | 31 (8) | 23 (5) | 13 (3) | 14 (7) | 14 (4) | |||||
| A2 | 8 (2) | 39 | 23 (5) | 55 | – | 13 | 18 (9) | 42 | 29 (9) | 43 |
| A3 | – | 9 (2) | – | 10 (5) | – | |||||
| B1 | – | – | 13 (3) | 29 (14) | – | |||||
| B2 | 15 (4) | – | 32 (8) | 10 (5) | 29 (9) | |||||
| B3 | 19 (5) | 42 | – | 45 | – | 74 | 15 (7) | 58 | 6 (2) | 51 |
| B4 | 8 (2) | 9 (2) | 8 (2) | 4 (2) | 10 (3) | |||||
| B5 | – | 36 (8) | 21 (5) | – | 6 (2) | |||||
| C1 | – | – | – | – | 6 (2) | |||||
| C2 | – | 19 | – | 0 | – | 13 | – | 0 | – | 6 |
| C3 | 19 (5) | – | 13 (3) | – | – | |||||
The “Scoliosis” group presented a large variety of profiles, with a great frequency of upper localization of the level of junction of the sagittal curves. This variability was related to topographies of the frontal curves ( Table 4 ). For the group “scoliotic attitude”, there were more types B than for the “control” group. The types C, absent in the “control” group, were observed in this group “attitude” and only in the “thoracic scoliosis” cases (for which the types B were prevalent). For the groups “double”, “lumbar” and “thoraco-lumbar” scoliosis, the types A and B were distributed with a prevalence of the types B for the “lumbar” and especially “thoraco-lumbar” scoliosis, of the types A for “double” curves.
The types characterized by an obliteration of the curves (B2, B5, C3) prevailed for the “thoracic scoliosis” (64%), those by a increasing of the curves (A2, A3, B1, B3, B4, C1) prevail for the “lumbar scoliosis” (51% of the cases) and especially for the “thoraco-lumbar scoliosis” (72%).
1.3.3
Sequences of optical examinations
A group of 143 subjects were controlled during their follow-up by successive examinations: 37 cases of “Spinal Pain” – 108 examinations, 77 “Scoliosis” – 221 examinations, 15 “Kyphosis” – 45 examinations and 14 “Fracture” – 38 examinations. The “morphometrical evolution” was connected to the “clinical evolution”.
For “Kyphosis”, ten cases were tilted of more than 4° forwards: two were still painful and forward tilted, eight corrected the forward tilt with clinical improvement, four of them by increasing of lumbar lordosis and the four others by pelvic mobilization (increasing of the pelvic arrow), the sagittal curves being identical.
In the group “Fracture”, only one case accentuated its pain and the forward tilt because of an associated weakening disease, eight remained balanced and painless, two remained forwards and painful, and three cases had a clear clinical improvement, with restoration of a quite vertical global trunk tilt “GTT” (being initially 10° forwards).
In the group “Scoliosis”, only five cases were painful, each one with a forward GTT of more than 4°. Three remained in the same state, two had an improvement. The 72 other cases had a balanced total axis and remained it.
For the 37 cases of “Spinal Pain”, ten were balanced at the time of the initial examination (eight remained it and two misbalanced forwards), 27 were forward tilted: only one had rebalanced itself, with clinical improvement, the others remained symptomatic.
1.4
Discussion
The use of optical techniques was proposed and validated for screening and follow-up of spinal deformities, especially by the detection of rib hump accentuation . In scoliosis, the relationship between the topography of the frontal curves and the sagittal shape was observed in our study by morphometry, similarly to the radiographic published data .
Analysis of the sagittal plane was poorly reported. Berryman et al. reported a mean value of 33.8° (SD 13.4, 6–66) for kyphosis and a standard deviation of the mean difference between pairs of measurements of 3.18° . This was similar to our observations. Also, Weiss stated that the kyphosis angle measured by optical techniques had a technical error of only 5%, like for the X-ray measurements . Therefore, he validated optical techniques for following up of patients with Sheuermann’s disease because the observed range of changes was far greater than the margin of error . Nevertheless, the use of such optical techniques was not thoroughly described for the analysis of the sagittal balance in various pathologies. The lack of significant correlation between sagittal optical and radiographic parameters was attributed to the differences between the structures appraised by each technique: the cutaneous back surface and the bony spine. Multiples factors interfered: the variability according to the level in the morphology of the cuneiform vertebral bodies, the anatomy of the posterior arch, particularly the length and orientation of the spinous process, the variable distances between the skin and the centres of the vertebral bodies. This lack of correlation implicated an initial plain lateral x-ray of the spine and pelvis to assess an initial individual analysis of the spinal balance (PI, SS, LA, Δ SS, Δ Lord or Δ Lord-optimal), after which the interpretation of the morphometric evolution was effective.
Assessment of GTT was essential to evaluate the sagittal balance. Sensitivity and the reliability of the optical technique were also attested by the strict relation between the GTT and the radiographic C7S1 axis. But only this parameter was not sufficient to explain a pain. A disharmony of the curves was also considered. It was noticed that optical lordosis were often flattened when “Δ SS”, “Δ Lord” or “Δ Lord-optimal” were significant. The repetition of optical examinations allowed distinguishing individual strategies facing a perturbation. Some cases had capacities to restore a sufficient lordosis ( Fig. 5 ), some compensated by a pelvic mobilisation ( Fig. 6 ), some by both ( Fig. 7 ), some others remained unbalanced.
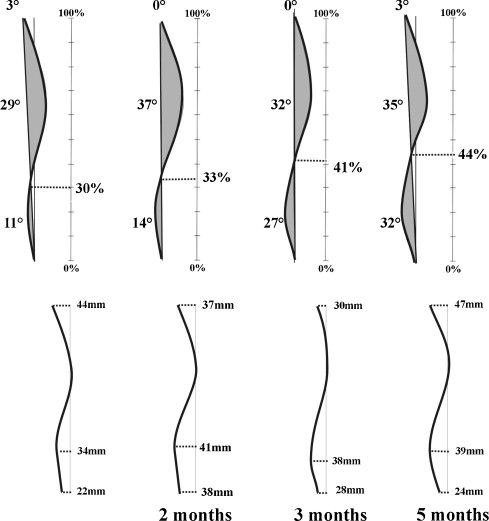
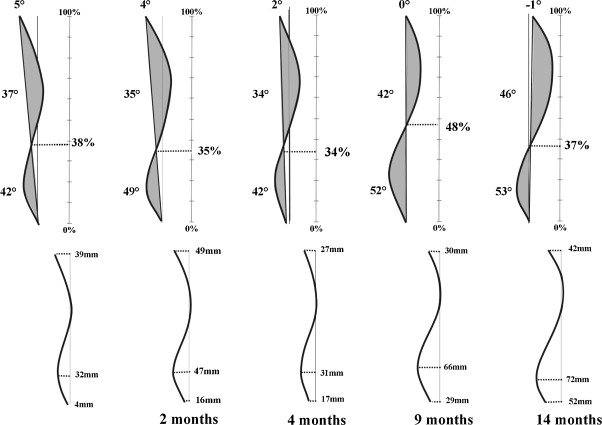
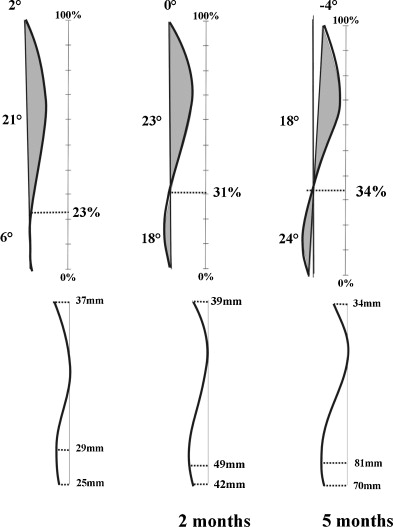
These repeated examinations also allowed to directly control the effect of a therapeutic or a postural adaptation. The three-dimensional appearance of the trunk (defined by the spinous process line for the scoliotic spine deformation and the back surface) allowed to integrate any disturbance, both for diagnosis and to control evolutions. Moreover, the subject was more conscious of his morphology by a simple imaging presentation and was stimulated for tracking to a concrete therapeutic objective.
Nevertheless, this technique was actually only static, upright but immobile. Ulterior technical improvements are essential to a dynamic approach of the 3D behaviour of the spino-pelvic complex in various postures and movements.
1.5
Conclusions
The use of this optical technique in the assessment and the follow-ups of the patients with spinal disturbances was founded reliable and risk free. An initial radiography allowed measuring the “Incidence Pelvic” and the respect of the amount of SS and lordosis, after which successive optical examinations were proposed to evaluate the patient’s reaction, integrated from the first radiographic evaluation but without supplementary irradiation. The technique was described useful to control or adjust therapeutic procedures and allows increasing the patient’s awareness of it-self and of the aim of the treatment.
Disclosure of interest statement
The author declares that he has no conflicts of interest concerning this article.
2
Version française
2.1
Introduction
L’analyse de l’équilibre sagittal du rachis est basée sur les relations entre plusieurs paramètres pelviens et rachidiens mesurés sur des radiographies de profil en position debout . Mais seul un suivi régulier permet d’évaluer l’évolution d’une pathologie ou le résultat d’une thérapeutique. Il en résulte un rayonnement ionisant significatif et potentiellement iatrogène à long terme, du fait de la répétition des radiographies .
Par ailleurs, des techniques optiques inoffensives ont été proposées pour l’analyse de la surface du dos, principalement pour le suivi des scolioses . Nous proposons ici l’utilisation d’une technique optique pour l’analyse et le suivi de la morphologie sagittale rachidienne.
2.2
Matériel et méthode
2.2.1
Le système optique
Le système Biomod L ® (AXS Ingenery, Mérignac, France) a été utilisé. Cette technique optique élabore une reconstruction tridimensionnelle de la surface du dos par l’analyse des déformations induites par le relief cutané sur un système de bandes lumineuses projetées (franges de Moiré) ( Fig. 1 ). Un éventuel bougé du sujet durant l’examen est automatiquement détecté et les données sont rejetées . Quatre marqueurs cutanés sont positionnés manuellement: sur l’apophyse postérieure de C7, sur les deux fossettes latérales du triangle de Michaelis et à l’aplomb du pli fessier.

