The purpose of this article is to determine if individuals with high rather than low femoral offset of a total hip arthroplasty achieve improved hip abductor muscle strength and thus improved their ability to step over an obstacle safely. These outcomes will help surgeons decide whether increasing the femoral offset helps a patient’s physical function.
- •
Failure to restore femoral offset in total hip replacement may compromise the safety of patients with total hip replacement performing the normal activities of daily living.
- •
To significantly improve patients’ ability to safely negotiate obstacles of heights commonly encountered, it may be helpful to increase femoral offset somewhat above the native state.
Introduction
Pain relief following total hip arthroplasty (THA) allows patients with arthritis of the hip to perform more of their daily and recreational activities. Consequently, the increased physical activity should promote the restoration of muscle function. However, a meta-analysis of recovery of physical function 6 to 8 months after THA revealed that THA patients perceived their physical function to be 80% that of equivalent controls, and increases in levels of daily activity were meager.
Stability and efficiency of gait represents an important measure of post-THA hip function. Several investigators have reported that residual gait impairments still persist several years after the surgery. Weakness of the hip abductor muscles in individuals with THA has been found to be associated with poor gait patterns, with patients demonstrating abnormalities such as a decreased single-limb stance time, decreased hip extension motion and hip abduction moment, and a positive Trendelenburg sign. Atypical muscle activation patterns of the hip abductor muscles of THA individuals may also affect locomotor ability.
It has been demonstrated that one of the most effective methods to improve the mechanical leverage of the hip abductor muscles is to increase the femoral offset (FO) of the hip prosthesis. FO is defined as the perpendicular distance from the long axis of the femur to the center of rotation of the femoral head. The FO of the THA limb is said to be restored, high, or low, respectively, if it is the same, longer, or shorter than that of the natural state. Several investigators have revealed the advantages of restored or high FO compared with low FO, including improved hip stability, range of motion, and hip abductor strength. However, whether these advantages improve physical function during a demanding lower extremity gait task remains unknown.
For gait, use of the THA hip abductor muscles during ipsilateral single-limb support is essential in controlling pelvic obliquity and maintaining upright balance of the trunk. During the THA single-support phase, the weight of the body (minus that of the THA limb) creates a torque on the pelvis that attempts to laterally tilt the pelvis downward on the non–THA-limb side. To keep the pelvis upright, the hip abductors must create an equivalent countermoment on the trunk. Simplistically assuming that all other factors remain constant, THA patients with a high FO should be able to generate sufficient hip abductor muscle torque to maintain appropriate pelvic obliquity and an upright trunk posture, in comparison with patients with a low FO. However, it is unclear whether this supposition is true.
For this study, to assess whether FO affects hip abductor strength, and consequently whether strength differences make a functional difference to THA patients, the authors used a gait task that requires higher levels of balance and pelvic obliquity control than level walking; specifically, stepping over an obstacle. It was anticipated that during the THA single-support phase, THA patients with a high FO (HI-FO) would be able to produce more adaptations to higher obstacle heights kinematically than would those with a low FO (LO-FO). Simultaneously, LO-FO patients were expected to display greater electrical activation and poorer trunk and limb control as the height of the obstacle increased.
Therefore, the purposes of this study were to determine: (a) if HI-FO in comparison with LO-FO would display increased hip abductor muscle strength and, consequently, differences in gait kinematics and level of muscle activation during the crossing of an obstacle; and (b) whether these FO-group differences would be greater as obstacle height increased.
Methods
Participants
The study included 20 participants who had previously undergone a unilateral, primary THA resulting from hip osteoarthritis, performed by one surgeon (O.M.M.). Potential participants were excluded if they had leg length discrepancy of greater than 20 mm, or any functional, neurologic, or morphologic disorders affecting gait. All participants had a reconstructed hip joint with well-fixed, uncemented acetabular and femoral components; all contralateral hips were disease-free with normal radiologic findings. Postoperative time ranged from 18 to 80 months (mean, 43 months).
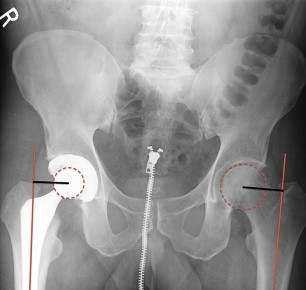
To classify the participants into the LO-FO or HI-FO groups, standard hip and pelvic radiographs of each participant were used to measure the FO of both hips ( Fig. 1 ). Based on pilot testing and practical ranges of FO used in the surgeon’s practice, the current study focused on participants for whom FO of the reconstructed hip differed in magnitude from that of the normal contralateral hip by more than ± 5%. Participants were classified into the HI-FO group if the FO of the THA hip was greater than 105% the FO of the non-THA hip (range, 106%–139%; median, 118%), and the LO-FO group if the FO of the THA hip was less than 95% the FO of the non-THA hip (range, 73%–95%; median, 87%). The characteristics of the 9 LO-FO and 11 HI-FO participants are shown in Table 1 .
| Characteristic | FO Group | |
|---|---|---|
| LO-FO (n = 9) | HI-FO (n = 11) | |
| Age (y) | 68 (7) | 65 (5) |
| Height (m) | 1.72 (0.14) | 7.78 (0.09) |
| Postoperative time (mo) | 51 (27) | 41 (14) |
| FO of THA limb (mm) a | 38 (9) | 48 (6) |
| Johanson Hip Rating Questionnaire a (100 points total score b ) | 89 (7) | 97 (3) |
| Gender | ||
| No. of females | 4 | 3 |
| No. of males | 5 | 8 |
a Indicates significant FO group difference ( P <.05).
Instrumentation
A Cybex 6000 isokinetic dynamometer (Lumex Inc, Ronkonkoma, NY) was used to test hip abductor muscle strength. A Myopac electromyography system (Run Technologies, Inc, Mission Viejo, CA) was used to collect the surface electromyographic (EMG) signals (sampling rate: 1080 Hz; common mode rejection ratio: 90 dB minimum at 60 Hz; input impedance: 1 MΩ) of the gluteus medius (GM), the rectus femoris (RF), and the biceps femoris (BF) muscles of the THA limb. Bipolar surface electrodes (Ag-AgCl, diameter = 34 mm, interelectrode distance = 2 cm; Blue Sensor; Medicotest, Inc, Oelstykke, Denmark) were placed on the skin according to SENIAM (Surface EMG for Non-Invasive Assessment of Muscles) conventions.
For the gait tasks, an obstacle comprising a 1.2-m long lightweight-wood crossbar (0.02 m × 0.02 m cross-sectional area) held up by adjustable posts (or a strip of tape on the ground for the no-obstacle test condition) was set at the midpoint of the 8-m walkway. Photocells connected with a chronometer were placed 1 m before and after the obstacle to monitor walking speed. For motion capture, a set of 27 retroreflective markers modified from Kadaba and colleagues were placed bilaterally on locations of the participant’s body. A retroreflective marker was placed at either end of the obstacle’s crossbar to define the obstacle’s position. Three-dimensional marker trajectories were captured using 4 video cameras (sampling rate: 60 Hz; shutter speed: 1/1000 s) in conjunction with a Peak Motus motion measurement system (v 4.3; Peak Performance Technologies, Inc, Englewood, CO).
Procedures
Each participant signed a consent form approved by the institution’s human subjects institutional review. Next, the proprietary pretest questionnaire regarding current health and participation in physical activity and the Johanson Hip Rating Questionnaire were completed. The Hip Rating Questionnaire produces a 100-point total rating, with a higher score indicating better hip rating. Participants underwent anthropometric testing after completion of questionnaires.
For the strength testing, after completing a warm-up and submaximal-effort acclimation trials, the participant performed 2 maximal-effort isometric trials to determine the preload for the concentric test. Three trials of maximum effort concentric abduction (30°/s) with 1 minute of rest between repetition trials then were executed. The non-THA limb was tested first to reduce the participants’ anxiety about generating maximum force during a novel task using their THA limbs. For each limb, the trial displaying the greatest peak torque was selected for later analysis.
In preparation for the obstacle gait task, the performer stood in a natural stance with the lower extremities facing forward as close to neutral alignment as the participant could attain. The spatial locations of the markers during the natural standing position were captured by the video cameras to later standardize the joint angles displayed during gait. The gait task consisted of walking, stepping over the obstacle, and then continuing walking to the end of the walkway at the participant’s natural, self-selected speed that was established during practice trials using the photocell times. The starting position for each participant was adjusted to allow a minimum of 4 steps before reaching the obstacle and to ensure that the THA limb was the stance limb while the obstacle was crossed. The obstacle height conditions corresponded to 0% (level ground), 10%, and 25% of the participant’s leg length. These heights corresponded to heights often encountered during daily life, for example, walking over an object on the floor or over a door threshold, or up a staircase. The average heights used in this study were 8.7 ± 0.7 cm and 21.8 ± 1.7 cm for the 10% and 25% obstacle heights, respectively. Three acceptable trials were performed at each obstacle height, from the lowest to the highest height, while the video cameras captured the reflective marker locations.
Data Reduction
To ascertain hip strength, the peak hip abductor torque value was selected for analysis. For descriptive purposes, the torque values of both limbs were scaled to body mass. As other factors, such as height, gender, and physical activity, can influence muscle torques, the THA-limb torque value was scaled to that of the non-THA limb. Moreover, it is important to understand strength deficits, so this relative value was used for statistical comparisons.
For the obstacle gait task data, 3-dimensional coordinates of the markers were reconstructed using a modified direct linear transformation, then smoothed using an optimized, smoothing-factor quintic spline. The phase of interest was the THA-limb stride that began with THA-limb foot contact and displayed the non-THA limb crossing the obstacle during the THA-limb single-support phase.
Typical spatiotemporal gait variables were calculated. In addition, foot-obstacle clearance of the non-THA limb was defined as the vertical distance between the highest vertical point displayed by the THA-limb toe marker during its swing phase and the vertical position of the obstacle’s crossbar.
Angular positions of the pelvis and joint angular positions of the non-THA limb about all 3 clinical axes and the flex/extension axes for the knee and ankle joints of the non-THA limb were generated based on Davis and colleagues and a modified method by Grood and Suntay. All angular position data of each trial were adjusted to natural standing angles. To understand the effect of FO and obstacle height on the kinematic strategy used to step over the obstacle, crossing angles were generated. The crossing angle for a given angle was the angle displayed at the instant of the highest toe-obstacle clearance height of the non-THA limb.
To assess the stability of the body, the body center of mass (COM) was calculated, based on a 13-segment whole-body model using segment anthropometric formulas modified from Winter and de Leva. Total body COM displacements in the mediolateral, vertical, and anteroposterior directions were used to represent how far the body moved during the crossing stride.
The raw EMG signals were bandpass-filtered (10–450 Hz) before generating root-mean-square (RMS) values (T = 53 ms). RMS values of a given muscle for the 10% and 25% obstacle-height conditions were scaled to the average of the RMS displayed during the support phase of the 0% height condition, and reported for the subphases of the THA-limb support phase.
Statistical Analysis
To determine if hip abductor strength varied between FO groups, comparisons of the relative hip abductor torques between the LO-FO and HI-FO THA limbs were made by Student t -tests, respectively. To compare FO groups for the obstacle task outcomes, 2 (FO group) × 3 (obstacle height) mixed-measures analyses of variance (ANOVA), with obstacle height as a within-subject factor and FO group as a between-subjects factor, were performed. If a significant interaction or main effect was detected, post hoc comparisons were performed using Bonferroni-adjusted t- tests. An α level of .05 was used for all statistical tests of significance. Statistical analyses were undertaken using SPSS v. 11 for Windows (SPSS Inc, Chicago, IL). A sample size of at least 9 participants per FO group would have at least 80% power to detect mean differences of 10° hip abduction angle, 7° pelvic obliquity, and 35% RMS EMG for GM using Student t -test at α = .05 and assuming standard deviations of 8°, 5°, and 25%, respectively, based on pilot data.
Methods
Participants
The study included 20 participants who had previously undergone a unilateral, primary THA resulting from hip osteoarthritis, performed by one surgeon (O.M.M.). Potential participants were excluded if they had leg length discrepancy of greater than 20 mm, or any functional, neurologic, or morphologic disorders affecting gait. All participants had a reconstructed hip joint with well-fixed, uncemented acetabular and femoral components; all contralateral hips were disease-free with normal radiologic findings. Postoperative time ranged from 18 to 80 months (mean, 43 months).
To classify the participants into the LO-FO or HI-FO groups, standard hip and pelvic radiographs of each participant were used to measure the FO of both hips ( Fig. 1 ). Based on pilot testing and practical ranges of FO used in the surgeon’s practice, the current study focused on participants for whom FO of the reconstructed hip differed in magnitude from that of the normal contralateral hip by more than ± 5%. Participants were classified into the HI-FO group if the FO of the THA hip was greater than 105% the FO of the non-THA hip (range, 106%–139%; median, 118%), and the LO-FO group if the FO of the THA hip was less than 95% the FO of the non-THA hip (range, 73%–95%; median, 87%). The characteristics of the 9 LO-FO and 11 HI-FO participants are shown in Table 1 .

| Characteristic | FO Group | |
|---|---|---|
| LO-FO (n = 9) | HI-FO (n = 11) | |
| Age (y) | 68 (7) | 65 (5) |
| Height (m) | 1.72 (0.14) | 7.78 (0.09) |
| Postoperative time (mo) | 51 (27) | 41 (14) |
| FO of THA limb (mm) a | 38 (9) | 48 (6) |
| Johanson Hip Rating Questionnaire a (100 points total score b ) | 89 (7) | 97 (3) |
| Gender | ||
| No. of females | 4 | 3 |
| No. of males | 5 | 8 |
a Indicates significant FO group difference ( P <.05).
Instrumentation
A Cybex 6000 isokinetic dynamometer (Lumex Inc, Ronkonkoma, NY) was used to test hip abductor muscle strength. A Myopac electromyography system (Run Technologies, Inc, Mission Viejo, CA) was used to collect the surface electromyographic (EMG) signals (sampling rate: 1080 Hz; common mode rejection ratio: 90 dB minimum at 60 Hz; input impedance: 1 MΩ) of the gluteus medius (GM), the rectus femoris (RF), and the biceps femoris (BF) muscles of the THA limb. Bipolar surface electrodes (Ag-AgCl, diameter = 34 mm, interelectrode distance = 2 cm; Blue Sensor; Medicotest, Inc, Oelstykke, Denmark) were placed on the skin according to SENIAM (Surface EMG for Non-Invasive Assessment of Muscles) conventions.
For the gait tasks, an obstacle comprising a 1.2-m long lightweight-wood crossbar (0.02 m × 0.02 m cross-sectional area) held up by adjustable posts (or a strip of tape on the ground for the no-obstacle test condition) was set at the midpoint of the 8-m walkway. Photocells connected with a chronometer were placed 1 m before and after the obstacle to monitor walking speed. For motion capture, a set of 27 retroreflective markers modified from Kadaba and colleagues were placed bilaterally on locations of the participant’s body. A retroreflective marker was placed at either end of the obstacle’s crossbar to define the obstacle’s position. Three-dimensional marker trajectories were captured using 4 video cameras (sampling rate: 60 Hz; shutter speed: 1/1000 s) in conjunction with a Peak Motus motion measurement system (v 4.3; Peak Performance Technologies, Inc, Englewood, CO).
Procedures
Each participant signed a consent form approved by the institution’s human subjects institutional review. Next, the proprietary pretest questionnaire regarding current health and participation in physical activity and the Johanson Hip Rating Questionnaire were completed. The Hip Rating Questionnaire produces a 100-point total rating, with a higher score indicating better hip rating. Participants underwent anthropometric testing after completion of questionnaires.
For the strength testing, after completing a warm-up and submaximal-effort acclimation trials, the participant performed 2 maximal-effort isometric trials to determine the preload for the concentric test. Three trials of maximum effort concentric abduction (30°/s) with 1 minute of rest between repetition trials then were executed. The non-THA limb was tested first to reduce the participants’ anxiety about generating maximum force during a novel task using their THA limbs. For each limb, the trial displaying the greatest peak torque was selected for later analysis.
In preparation for the obstacle gait task, the performer stood in a natural stance with the lower extremities facing forward as close to neutral alignment as the participant could attain. The spatial locations of the markers during the natural standing position were captured by the video cameras to later standardize the joint angles displayed during gait. The gait task consisted of walking, stepping over the obstacle, and then continuing walking to the end of the walkway at the participant’s natural, self-selected speed that was established during practice trials using the photocell times. The starting position for each participant was adjusted to allow a minimum of 4 steps before reaching the obstacle and to ensure that the THA limb was the stance limb while the obstacle was crossed. The obstacle height conditions corresponded to 0% (level ground), 10%, and 25% of the participant’s leg length. These heights corresponded to heights often encountered during daily life, for example, walking over an object on the floor or over a door threshold, or up a staircase. The average heights used in this study were 8.7 ± 0.7 cm and 21.8 ± 1.7 cm for the 10% and 25% obstacle heights, respectively. Three acceptable trials were performed at each obstacle height, from the lowest to the highest height, while the video cameras captured the reflective marker locations.
Data Reduction
To ascertain hip strength, the peak hip abductor torque value was selected for analysis. For descriptive purposes, the torque values of both limbs were scaled to body mass. As other factors, such as height, gender, and physical activity, can influence muscle torques, the THA-limb torque value was scaled to that of the non-THA limb. Moreover, it is important to understand strength deficits, so this relative value was used for statistical comparisons.
For the obstacle gait task data, 3-dimensional coordinates of the markers were reconstructed using a modified direct linear transformation, then smoothed using an optimized, smoothing-factor quintic spline. The phase of interest was the THA-limb stride that began with THA-limb foot contact and displayed the non-THA limb crossing the obstacle during the THA-limb single-support phase.
Typical spatiotemporal gait variables were calculated. In addition, foot-obstacle clearance of the non-THA limb was defined as the vertical distance between the highest vertical point displayed by the THA-limb toe marker during its swing phase and the vertical position of the obstacle’s crossbar.
Angular positions of the pelvis and joint angular positions of the non-THA limb about all 3 clinical axes and the flex/extension axes for the knee and ankle joints of the non-THA limb were generated based on Davis and colleagues and a modified method by Grood and Suntay. All angular position data of each trial were adjusted to natural standing angles. To understand the effect of FO and obstacle height on the kinematic strategy used to step over the obstacle, crossing angles were generated. The crossing angle for a given angle was the angle displayed at the instant of the highest toe-obstacle clearance height of the non-THA limb.
To assess the stability of the body, the body center of mass (COM) was calculated, based on a 13-segment whole-body model using segment anthropometric formulas modified from Winter and de Leva. Total body COM displacements in the mediolateral, vertical, and anteroposterior directions were used to represent how far the body moved during the crossing stride.
The raw EMG signals were bandpass-filtered (10–450 Hz) before generating root-mean-square (RMS) values (T = 53 ms). RMS values of a given muscle for the 10% and 25% obstacle-height conditions were scaled to the average of the RMS displayed during the support phase of the 0% height condition, and reported for the subphases of the THA-limb support phase.
Statistical Analysis
To determine if hip abductor strength varied between FO groups, comparisons of the relative hip abductor torques between the LO-FO and HI-FO THA limbs were made by Student t -tests, respectively. To compare FO groups for the obstacle task outcomes, 2 (FO group) × 3 (obstacle height) mixed-measures analyses of variance (ANOVA), with obstacle height as a within-subject factor and FO group as a between-subjects factor, were performed. If a significant interaction or main effect was detected, post hoc comparisons were performed using Bonferroni-adjusted t- tests. An α level of .05 was used for all statistical tests of significance. Statistical analyses were undertaken using SPSS v. 11 for Windows (SPSS Inc, Chicago, IL). A sample size of at least 9 participants per FO group would have at least 80% power to detect mean differences of 10° hip abduction angle, 7° pelvic obliquity, and 35% RMS EMG for GM using Student t -test at α = .05 and assuming standard deviations of 8°, 5°, and 25%, respectively, based on pilot data.
Related posts:
 Comparative Analysis of Periarticular Osteolysis in Modern Total Hip Bearings
Highly Cross-linked Polyethylene in Posterior Stabilized Total Knee Arthroplasty
Blood Loss and Transfusion Rates Following Patellofemoral Arthroplasty
Highly Cross-linked Polyethylene in Posterior Stabilized Total Knee Arthroplasty
The Importance of Acetabular Component Position in Total Hip Arthroplasty
Retrieval Analysis of Nonmodular Constrained Tibial Inserts After Primary Total Knee Replacement
Comparative Analysis of Periarticular Osteolysis in Modern Total Hip Bearings
Highly Cross-linked Polyethylene in Posterior Stabilized Total Knee Arthroplasty
Blood Loss and Transfusion Rates Following Patellofemoral Arthroplasty
Highly Cross-linked Polyethylene in Posterior Stabilized Total Knee Arthroplasty
The Importance of Acetabular Component Position in Total Hip Arthroplasty
Retrieval Analysis of Nonmodular Constrained Tibial Inserts After Primary Total Knee Replacement
Stay updated, free articles. Join our Telegram channel

Full access? Get Clinical Tree


