Abstract
Stroke is a major public health issue. Even though most hemiplegic stroke patients may obtain a good functional outcome, many remain dissatisfied with their lives. Indeed, quality of life and subjective well-being should be taken into account in any assessment of stroke survival.
Objective
To assess long-term quality of life in stroke patients (compared with healthy controls) and the corresponding determinants and predictive factors.
Method
The patient population consisted of 80 of the 217 first-stroke survivors treated between January and June 2005 in the Clinical Neurosciences Department at Bordeaux University Hospital. After a mean follow-up period of 2 years, 24 patients were interviewed in their homes and data from the 56 others were obtained in a telephone interview. Demographic information, clinical status on admission and functional status (as assessed by Barthel Index) and depression (on the ADRS) at the time of the study visit were recorded. Quality of life was assessed by using the Sickness Impact Profile (SIP-65) and Bränholm and Fugl-Meyer’s Satisfaction with Life Scale (LiSat 11). The patients’ data were compared with those from 149 healthy controls.
Results
Life satisfaction and quality of life were significantly impaired in stroke patients, compared with controls. All life domains were impaired. The worst scores were observed for independence and health-related items in the LiSat 11 and the physical and communication items in the SIP-65. Quality of life was strongly correlated with functional independence, the persistence of hemiplegia and depressive mood, which is in agreement with literature findings. Neither gender nor the initial Rankin score had a significant impact on these parameters.
Discussion–Conclusion
Quality of life at 2 years is significantly impaired in stroke survivors and seems more difficult to predict than functional independence. However, in addition to these objective results, our interviews suggest that receiving adequate social support might be as important to patients as recovering independence.
Résumé
L’accident vasculaire cérébral (AVC) est un problème majeur de santé publique. Bien que la plupart des personnes qui en sont victimes retrouvent une autonomie satisfaisante, nombre d’entre elles restent insatisfaites de leur vie. L’évaluation de ses conséquences doit donc être complétée par celle de la qualité de la vie.
Objectif
Évaluer la qualité de vie de personnes victimes d’un AVC, à distance de celui-ci et la comparer avec celle de témoins sains afin d’en définir les déterminants et les facteurs prédictifs.
Méthode
Il s’agit d’une étude sur 80 des 217 personnes victimes d’un premier AVC, hospitalisées dans les unités du pôle de neurosciences cliniques du CHU de Bordeaux du 1 er janvier au 30 juin 2005 inclus. Deux ans plus tard, 24 patients ont été rencontrés et examinés à leur domicile, et 56 autres ont été interrogés par téléphone. Les données sociodémographiques, les caractéristiques de l’AVC, l’autonomie évaluée par l’index de Barthel et le statut psychologique évalué par l’échelle ADRS ont été pris en compte. La qualité de vie a été explorée au moyen du Sickness Impact Profile (SIP-65) et la satisfaction de vie par l’échelle de Bränholm et Fugl-Meyer (LiSat 11). Les données ont été comparées à celle de 149 témoins ayant rempli les mêmes questionnaires.
Résultats
La qualité de la vie des patients est significativement moins élevée que celle des témoins. Tous les domaines sont altérés et plus particulièrement ceux de la satisfaction vis-à-vis de l’autonomie, de la santé physique, de l’état psychologique, de la vie en général, des loisirs et des contacts avec les amis de l’échelle de LiSat 11, ainsi que la dimension physique, l’humeur et la communication du SIP-65. L’indépendance fonctionnelle ainsi que la dépression sont, dans cette étude, les variables qui influencent le plus la qualité de vie des patients, ce qui est concordant avec la littérature. Il n’a pas été retrouvé d’influence significative du sexe ni du score de Rankin initial sur ces paramètres.
Discussion–Conclusion
La qualité de la vie après un AVC est significativement altérée mais semble moins prévisible que la récupération fonctionnelle. Cependant, malgré ces résultats objectifs, l’opinion subjective des patients suggérerait que la récupération de leur autonomie serait à leurs yeux moins importante que l’obtention d’un meilleur soutien social.
1
English version
In industrialised countries, stroke is the leading cause of motor handicap, the second-ranked cause of dementia and the third-ranked cause of mortality. A stroke occurs every 4 minutes in France, i.e. around 130,000 per year . It has been estimated that 10% of patients die within a month of the stroke. On average, 20% of the survivors remain in an institution and 80% return home. However, around 50% of those who returned home present very invalidating impairments (primarily hemiparesis and aphasia) .
Stroke leads to major significant functional sequelae but objective assessment tools often fail to capture the subjective impact of these impairments. Hence, stroke outcome indicators must also take account of the victim’s quality of life.
The concept of “quality of life” is complex, in as much as there is no unanimously accepted definition of this multidimensional, highly subjective parameter. Despite the development of around 5000 generic or disease-specific assessment tools (many of which have been criticized for various reasons), a universal instrument for quality of life assessment does not exist.
Some authors have focused on quality of life in stroke victims by using a variety of specific or generic scales. Most such studies describe patients hospitalized in physical and rehabilitation medicine (PRM) departments, with population sizes ranging from 46 to 639 and (in some cases) a comparator group of healthy subjects. A review of the literature suggests that stroke victims’ quality of life is markedly impaired – especially when compared with that of the general population. For example, in 2006, Kwok et al. observed a decrease in the quality of life for 304 Chinese stroke victims. The “environment” and “social interaction” domains were most affected . In 2007, by comparing 508 stroke subjects with controls, Kranciukaite et al. also observed poorer quality of life in the physical and psychological health domains of the short-form SF-36 . However, when studying 304 Swedish stroke victims in 2005, Jonsson et al. observed that quality of life was lower for physical parameters of the SF-36 but that social, emotional and mental components improved (suggesting internal adaptation to changes in the patients’ life situations) . In all these studies, the most significant predictive factors corresponded to not only functional domains but also more subjective domains, such as depression. The influence of sociodemographic factors has been demonstrated: age , female gender , living alone versus living in an institution , a low socio-economic or educational level and unemployment . In 2005, Gallien et al. also demonstrated the impact of post-stroke falls and urinary incontinence.
However, the great majority of these studies had limitations and sources of bias, such as (i) the almost systematic exclusion of aphasic, elderly or demented patients, (ii) direct recruitment in PRM units and (iii) the absence of comparison with the general population.
Very few of the above-cited studies were performed in France. In fact, the cultural and social nature of the concept of “quality of life” means that it is difficult to extrapolate results from other countries to French patients. Hence, there is a need for targeted data in a French patient population and the process has been initiated by Bethoux et al. and Gallien et al. . In 1999, Bethoux et al. studied 45 subjects and observed lower than normal quality of life (notably for indoor/outdoor mobility and family roles & activities) that worsened over time. Gallien et al. observed poor quality of life (using the SF-36) in 50 subjects, relative to French normative values.
The present, retrospective study therefore sought to (i) complement these two French studies by evaluating post-stroke quality of life, (ii) compare the stroke victims with nominally healthy controls and (iii) define the main determinants and predictive factors.
1.1
Material and methods
1.1.1
Assessment methods used and variables studied
Demographic and anamnestic data were collected from medical files and patient questionnaires. The following parameters were extracted: biographic data, sociodemographic data before and after the stroke; the stroke’s nature, mechanism and initial severity (on the modified Rankin scale ), comorbidities and the length of hospitalisation in acute care departments. The questionnaire recorded any ongoing treatments, the stroke’s sequelae, any rehabilitation care in an institution or in private practice, physiotherapy and/or speech therapy, falls, urinary incontinence, home help (whether human, technical or financial) and any contact with a stroke association.
The study participants filled out several different French-language questionnaires.
The Aphasia Depression Rating Scale (ADRS, a shortened, French-language version of the Montgomery and Asberg Depression Rating Scale [MADRS] for aphasic people, as validated by Benaim et al. ) was used to estimate depression.
The Barthel Index enabled us to evaluate limitations in the activities of daily living.
The Bränholm and Fugl-Meyer Satisfaction with Life Scale (LiSat 11) ( Appendix 1 ) explored 11 domains on visual analogue scales: life as a whole, independence, the leisure situation, the vocational situation, economy, sexual life, the partner relationship, family life, contacts with friends, physical health and psychological health . A French-language version was used, with a view to its validation in the present study.
The Sickness Impact Profile (SIP-65) ( Appendix 2 ) was also used to evaluate the quality of life. It uses 65 true/false questions to explore 11 domains: sleep & rest, emotional behaviour, body care and ambulation, home management, mobility, social interaction, alertness behaviour, communication, work, recreation & pastimes and feeding. The SIP-65 is a shortened, French-language version of the SIP-136 that has been modified for use with aphasic people .
These various items of information were collated in three anonymous questionnaires administered as a function of the target population (a home interview, a postal questionnaire or a control questionnaire).
1.1.2
Study population
Study participants (of both genders and regardless of stroke type or age) were recruited consecutively between January 1st and June 30th, 2005, from among first-stroke victims hospitalized in the Clinical Neuroscience Department at Bordeaux University Hospital.
Patients having suffered from either (i) more than one stroke, (ii) a transient ischaemic attack or (iii) any other invalidating pathology that could have already altered their quality of life were excluded. Patients domiciled outside France or whose main language was not French were also excluded, as were deceased patients, those lost to follow-up, those hospitalized at the time of study inclusion and those having refused to participate following an explanation of the study objectives.
Pre-inclusion was performed in March 2007 by examining the hospitalisation records of patients admitted for stroke and who met the inclusion criteria. The patient’s contact details and those of their primary care physician were recorded at this time.
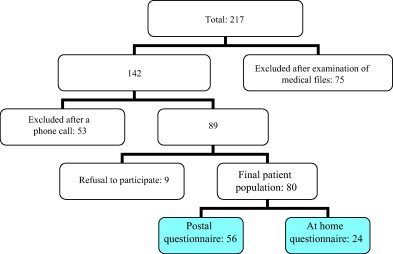
Initially, 217 people had been admitted for stroke but only 142 were included in the study at this point. The other 75 patients met one or more of the above-mentioned exclusion criteria: 42 had a history of cerebrovascular disease, 19 had another invalidating pathology and 14 had died during their time in hospital.
In April 2007, we telephoned the primary care physicians to inform them of the ongoing study, check that the patients were still alive and confirm the patients’ address.
At the end of this second phase, 53 patients were excluded (21 were deceased, 18 were lost to follow-up, three were resident outside France, seven had been hospitalized during the recruitment period and four were not French speakers). The remaining 89 patients were contacted by telephone, in order to provide them with study information and invite them to participate. At this point, nine people (4.15%) refused to participate in the study. Hence, the final patient population comprised 80 subjects (36.87% of the initially admitted population).
In view of their place of residence (the Gironde county around Bordeaux), 24 people (11.06%) were interviewed at home and constituted the “home questionnaire group”. As agreed by telephone, the other 56 participants (25.81%) received a postal questionnaire in May 2007, together with a letter explaining the study’s objectives. These patients were then contacted again by telephone between May and July 2007, in order to fill out the questionnaire with the main investigator.
The primary inclusion criterion for the control group was apparent good health at the time of the evaluation. Individuals with a history of serious medical or surgically-treated conditions that could have altered their quality of life or those undergoing arduous treatments were excluded. Throughout 2007, control subjects were recruited from the same age classes as the patients (via the investigator’s friends, family and acquaintances). The final sample of 149 age- and gender-matched controls filled out a “control questionnaire”.
This procedure is summarized in Fig. 1 .
1.1.3
Statistical analysis
When the means of the quantitative variables followed a normal distribution, the study groups were compared in a Student’s t test. Qualitative variables were compared with a χ 2 test.
To evaluate the influence of independent variables on life satisfaction and quality of life, we used the Kruskal-Wallis test (χ 2 ), the Mann-Whitney U test or Spearman’s Rho (depending on the variable in question).
The threshold for statistical significance was set to P < 0.05.
1.2
Results
The study data collected between 24 and 30 months post-stroke are summarized in Table 1 .
| Patients ( n = 80) | Controls ( n = 149) | Results | |
|---|---|---|---|
| Age (years) | 23 to 92 | 23 to 92 | t = −1.25 |
| M: 67.4 ± 13.5 | M: 65.22 ± 12.2 | P > 0.05 | |
| Gender | 51 M (63.75%) | 76 M (51.01%) | χ 2 = 3.42 |
| 29 F (36.25%) | 73 F (48.99%) | P > 0.05 | |
| Educational level | χ 2 = 4.52 P > 0.05 | ||
| Primary or secondary education | 33 (41.25%) | 41 (27.52%) | |
| High school diploma | 33 (41.25%) | 74 (49.66%) | |
| Higher education | 14 (17.5%) | 34 (22.82%) | |
| Marital status | χ 2 = 1.49 P > 0.05 | ||
| Cohabiting | 55 (68.75%) | 106 (71.14%) | |
| Single | 7 (8.75%) | 9 (6.04%) | |
| Divorced | 5 (6.25%) | 14 (9.40%) | |
| Widowed | 13 (16.25%) | 20 (13.42%) | |
| Place of residence | |||
| Urban area | 51 (63.75%) | 71 (47.65%) | |
| Rural area | 29 (36.25%) | 78 (52.35%) | |
| Domicile | |||
| Apartment | 22 (27.5%) | 30 (20.13%) | |
| House | 58 (72.5%) | 119 (79.87%) | |
| Professional status | |||
| In work | 17 (21.25%) | 43 (28.86%) | |
| Not in work | 63 (78.75%) | 106 (71.14%) | |
1.2.1
Description of the population
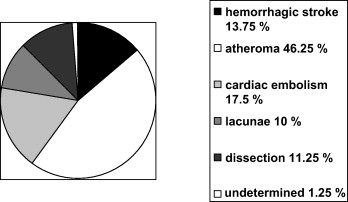
There were no significant differences between the patients and controls in terms of sociodemographic criteria and so the two groups could be validly compared. In terms of the 80 cases of stroke, there were 69 ischaemic strokes (86.25%) and 11 haemorrhagic strokes (13.75%), with 33 right-side lesions (41.25%), 39 left-side lesions (48.75%) and eight bilateral lesions (10%) ( Fig. 2 ).
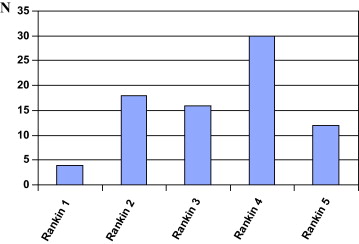
Impairments in the acute post-stroke phase were evaluated on the modified Rankin scale ( Fig. 3 ).
Fourteen (6.45%) of the 217 patients in the initial sample died during the acute phase of the stroke. Another 21 patients died during hospitalisation (9.68%). The estimated mortality rate in the present study was thus 16.13%. However, this is perhaps an underestimate because patients who die in acute care departments rarely have a hospitalisation report and are not specifically registered.
We observed 10 post-stroke changes in marital status: four divorces (5%), four widowhoods (5%) and two marriages or civil unions (2.5%). Several people changed their area of residence, with five people (6.25%) moving to town. Seven people (8.75%) moved out of their house and into an apartment and four (5%) moved out of their apartment into a house. Two of these changes (2.5%) corresponded to a move to a retirement home, whereas the remainder (11.25%) were more related to changes in the family situation than to stroke per se , according to the patients. Lastly, three people (3.75%) moved out of a relative’s home to live alone or with a partner and four others (5%) moved in with a member of their family.
In terms of professional activities, 17 people (21.25%) were in work, including six (7.5%) who switched to part-time work after the stroke and two former students (2.5%) who had found a job. Of the 63 non-employed patients (78.75%), two (2.5%) were unemployed (including one [1.25%] who was already unemployed before the stroke), two (2.5%) were registered as having had a workplace accident, two (2.5%) were on invalidity benefits and four (5%) were newly retired, whereas the other 53 (66.25%) were already retired at the time of the stroke.
At the time of the survey, the patients had also been screened for cardiovascular risk factors. Of the 80 patients, three (3.75%) did not have any risk factors, 10 (12.5%) had one risk factor and the remaining 47 (83.75%) had two or more risk factors.
For the 80 patients, the length of acute care hospitalisation averaged 14 ± 14.7 days and ranged from 2 to 103 days. Twenty-eight patients (35%) received care in a rehabilitation centre, for an average period of 2.18 ± 1.3 months.
In functional terms, 29 people (36.25%) reported no impairments, 34 (42.5%) reported slight impairments and 17 (21.25%) reported severe impairments. This is quite close to the true situation because the median Barthel Index was 85 out of 100 ( Table 2 ).
| Barthel Index | 0–20 | 21–40 | 41–60 | 61–90 | 91–100 |
|---|---|---|---|---|---|
| Number of patients | 3 | 6 | 5 | 15 | 51 |
| Percentage | 3.75 | 7.5 | 6.25 | 18.75 | 63.75 |
It is noteworthy that 16 patients (20%) stated that they had suffered from regular falls (at least once a month). Thirty-six patients (45%) were still receiving physiotherapy, 17 (21.25%) had stopped physiotherapy after 3 to 6 months (despite the absence of full recovery) and 27 (33.75%) had never received physiotherapy.
Twenty-five patients (31.25%) said that they had suffered from speech disorders ever since the stroke. Twelve of the latter (15% of the total patient population) were still receiving speech therapy and seven (8.75%) had abandoned speech therapy despite the persistence of speech disorders. The other 61 patients (76.25%) had never received speech therapy, despite the presence of aphasia in six (7.5%) of individuals at the time of the survey.
Depressive disorders were explored on the ADRS. For practical reasons, this questionnaire was only administered to the 24-strong “home questionnaire” group. The mean total score obtained was 7.21 ± 3.9 out of 32. Ten people (41.67%) were at or above cut-off value of 9 for a probable depressive episode (six of the 14 men [42.86%] and four of the 10 women [40%]).
These findings agreed with the apparent medication use because 29 patients (36.25%) were reportedly taking antidepressants.
Forty-one (51.25%) of the 80 patients received assistance at home: 26 had home help (63.41%), 26 (63.41%) used technical aids and 30 (73.17%) received financial assistance. Some patients received more than one type of assistance.
It is noteworthy that only one patient (1.25%) was in contact with a stroke association.
1.2.2
Quality of life
In terms of life satisfaction (evaluated with the LiSat 11), we found that the patients were significantly less satisfied than controls in all domains other than the vocational situation and the partner relationship ( Table 3 ). An analysis of the effect size showed that the most significant differences were observed for physical health, independence, life as a whole, psychological health, the leisure situation and contacts with friends. The vocational situation was not necessarily representative, given the high proportion of non-employed people in the patient and control groups.
| Items | Mean score for patients | Mean score for controls | t | P | d |
|---|---|---|---|---|---|
| Life as a whole | 6.52 ± 1.9 | 8.18 ± 1.3 | 7.76 | < 0.001 | 1.08 |
| Independence | 6.32 ± 2.2 | 8.49 ± 1.3 | 9.43 | < 0.001 | 1.30 |
| Leisure | 6.91 ± 1.8 | 8.24 ± 1.4 | 6.10 | < 0.001 | 0.86 |
| Profession | 6.63 ± 2.1 | 7.46 ± 2 | 1.5 | NS | 0.40 |
| Money | 6.60 ± 1.4 | 7.20 ± 2 | 2.34 | < 0.05 | 0.33 |
| Sexual life | 5.36 ± 2.2 | 6.67 ± 2.8 | 3.03 | < 0.01 | 0.50 |
| Partner relationship | 7.86 ± 1.4 | 7.85 ± 2 | −0.032 | NS | 0.00 |
| Family life | 7.28 ± 2 | 8.17 ± 1.6 | 3.59 | < 0.001 | 0.50 |
| Contacts with friends | 6.97 ± 1.8 | 8.29 ± 1.5 | 5.93 | < 0.001 | 0.82 |
| Physical health | 5.98 ± 1.7 | 8.01 ± 1.4 | 9.41 | < 0.001 | 1.34 |
| Psychological health | 6.51 ± 1.8 | 8.20 ± 1.4 | 7.74 | < 0.001 | 1.09 |
The SIP-65 results revealed that on average, patients were only half as satisfied as controls ( Table 4 ). This was primarily observed for the physical, communication and emotional behaviour domains. However, there were also two exceptions on this scale (sleep & rest and work), although it should again be borne in mind that the low proportion of people in employment could have biased the results.
| Items | Mean score for patients (0 to 1) | Mean score for controls (0 to 1) | t | P | d |
|---|---|---|---|---|---|
| Sleep & rest | 0.55 ± 0.4 | 0.55 ± 0.4 | 0.12 | NS | 0.00 |
| Emotional behaviour | 0.34 ± 0.3 | 0.14 ± 0.2 | −6.32 | < 0.001 | 0.83 |
| Body care and ambulation | 0.39 ± 0.3 | 0.9 ± 0.2 | −9.06 | < 0.001 | 2.13 |
| Home management | 0.35 ± 0.4 | 0.13 ± 0.2 | −5.44 | < 0.001 | 0.77 |
| Mobility | 0.32 ± 0.3 | 0.17 ± 0.2 | −3.93 | < 0.001 | 0.62 |
| Social interaction | 0.33 ± 0.3 | 0.21 ± 0.2 | −3.72 | < 0.001 | 0.50 |
| Alertness behaviour | 0.43 ± 0.3 | 0.26 ± 0.3 | −4.63 | < 0.001 | 0.57 |
| Communication | 0.2 ± 0.2 | 0.045 ± 0.1 | −7.61 | < 0.001 | 1.08 |
| Work | 0.81 ± 0.4 | 0.73 ± 0.4 | −1.36 | NS | 0.20 |
| Recreation & pastimes | 0.29 ± 0.3 | 0.18 ± 0.2 | −2.77 | < 0.001 | 0.46 |
| Feeding | 0.3 ± 0.3 | 0.19 ± 0.2 | −2.74 | < 0.001 | 0.46 |
We sought to determine (i) the predictive value of a number of independent variables (age, gender, educational level, the place of residence at the time of the stroke, type of stroke, length of initial hospitalisation and the Rankin score) and (ii) determinant factors (depression, limitation of activities, falls, aphasia and hemiplegia) for the most markedly different life satisfaction and quality of life scores.
1.2.3
Predictive factors
We did not find any significant influence of gender or the initial Rankin score on the parameters.
1.2.3.1
The Bränholm and Fugl-Meyer life satisfaction scale (LiSat 11)
Satisfaction with life in general was influenced by residence in an institution versus living at home at the time of the stroke (χ 2 = 6.15, P < 0.05) and by the duration of the initial hospitalisation in a neurology unit ( r = −0.28, P < 0.005).
Satisfaction with independence was influenced by age ( r = −0.41, P < 0.001), educational level (χ 2 = 7.30, P < 0.05), the type of stroke (ischaemic stroke vs. haemorrhagic stroke; U = 229, P < 0.05), residence in an institution or living at home (χ 2 = 8.9, P < 0.05) and the length of initial hospitalisation ( r = −0.40, P < 0.001).
Satisfaction with physical health was influenced by residence in an institution versus living at home at the time of the stroke (χ 2 = 6.98, P < 0.05), age ( r = −0.36, P < 0.01) and the length of hospitalisation ( r = −0.29, P < 0.05).
Satisfaction with psychological health was influenced by a rural versus urban place of residence at the time of the stroke (χ 2 = 6.63, P < 0.05) and the length of hospitalisation ( r = −0.28, P < 0.05).
Satisfaction with leisure was influenced by a rural versus urban place of residence at the time of the stroke (χ 2 = 10.01, P < 0.01), educational level (χ 2 = 6.51, P < 0.05), age ( r = −0.39, P < 0.001) and the length of hospitalisation ( r = −0.24, P < 0.05).
Lastly, satisfaction with contacts with friends was influenced by a rural versus urban place of residence at the time of the stroke (χ 2 = 6.65, P < 0.05), the type of stroke (U = 228.5, P < 0.05) and age ( r = 0.22, P < 0.05).
1.2.3.2
Sickness Impact Profile (SIP-65)
The physical domain of quality of life was influenced by age ( r = 0.44, P < 0.001), the length of hospitalisation ( r = 0.43, P < 0.001), residence in an institution versus living at home at the time of the stroke (χ 2 = 7.24, P < 0.05) and the type of stroke (U = 215.5, P < 0.05).
Mood was influenced by the length of hospitalisation ( r = 0.32, P < 0.01) and the type of stroke (U = 193, P < 0.01).
Lastly, the communication dimension was influenced by the length of initial hospitalisation ( r = 0.25, P < 0.05) and age ( r = 0.23, P < 0.05).
1.2.4
Determinant factors
1.2.4.1
The Bränholm and Fugl-Meyer life satisfaction scale (LiSat 11)
Satisfaction with life in general was correlated with the Barthel Index at the time of the survey ( r = 0.62, P < 0.001), the ADRS depression score ( r = −0.78, P < 0.001), the occurrence of falls (Mann and Whitney U = 281.5, P < 0.01) and the persistence of hemiparesis (H = 23.4, P < 0.001).
Satisfaction with independence was correlated with the occurrence of falls (U = 267, P < 0.001), depression ( r = −0.66, P < 0.001) and, understandably, the Barthel Index ( r = 0.83, P < 0.001) and the persistence of hemiparesis (H = 35.8, P < 0.001).
Satisfaction with physical health was correlated with the Barthel Index ( r = 0.68, P < 0.001), the occurrence of falls (U = 347.5, P < 0.05), depression ( r = −0.82, P < 0.001) and the persistence of hemiparesis (H = 25.2, P < 0.001).
Satisfaction with psychological status was correlated with the Barthel Index ( r = 0.47, P < 0.001) and depression ( r = −0.87, P < 0.001).
Satisfaction with leisure was correlated with the Barthel Index ( r = 0.67, P < 0.001), depression ( r = −0.75, P < 0.001) and falls (U = 320.5, P < 0.05).
Lastly, satisfaction with contacts with friends was correlated with the Barthel Index ( r = 0.40, P < 0.001), depression ( r = −0.71, P < 0.001) and falls (U = 320.5, P < 0.05).
1.2.4.2
The Sickness Impact Profile (SIP-65)
The physical dimension was correlated with the Barthel Index ( r = −0.84, P < 0.001), the depression score ( r = 0.71, P < 0.001), the occurrence of falls (U = 214, P < 0.001) and presence of hemiplegia (H = 34.8, P < 0.001).
The mood was correlated with the Barthel Index ( r = −0.61, P < 0.001) and the depression score ( r = 0.84, P < 0.001).
The communication domain was correlated with the Barthel Index ( r = −0.51, P < 0.001), the depression score ( r = 0.714, P < 0.001) and the occurrence of falls (U = 303.5, P < 0.01) – probably because people who fall frequently go out less and thus avoid communication situations. Unsurprisingly, the presence of aphasia was correlated with the communication domain (U = 223.5, P < 0.001) and presence of hemiplegia (H = 10.1, P < 0.01). Of course, these univariate analyses can only indicate trends, since the factors that influenced the quality of life and life satisfaction were not independent of each other.
1.3
Discussion
On the whole, the stroke victims’ life satisfaction and quality of life were significantly lower than those of controls, as found in the literature .
In the present study, the domains that differed most were independence, physical health, psychological health, life in general, leisure and contacts with friends in the LiSat 11 and physical status, emotional behaviour and communication in the SIP-65, as also found by De Haan et al. , Carod-Artal et al. and Mackenzie et al. . It is also noteworthy that in contrast to what has been reported in the literature, gender did not have an impact on the quality of life scores in the present study.
In the present study (as in other publications), perceived quality of life tended to be determined by:
- •
aphasia and communication (SIP-65) ;
- •
hemiparesis (LiSat 11) ;
- •
functional independence (Barthel Index, LiSat 11 and SIP-65) ;
- •
falls, independence (LiSat 11) and the physical domain (SIP-65) ;
- •
depression (LiSat 11 and SIP-65) .
Hence, we found few predictive factors and those that were identified only had a moderate influence. These notably included age, educational level , professional status , residence in an institution , living with another person at home and the length of hospitalisation (parameters not explored in the above-cited studies) and the type of stroke , which is in agreement with the literature.
The study’s strong points are related firstly to a recruitment process that was not restricted to PRM departments and thus (in contrast to many literature studies) did not exclude aphasic patients. It is also worth emphasizing the high patient response rate (100%), which testifies to good acceptance of investigational methods that sought to obtain as much information as possible while limiting constraints on the patients as much as possible. Lastly, all the scales and questionnaires used in this study had good psychometric properties qualities. In fact, the validity of the French-language of the Bränholm and Fugl-Meyer LiSat 11 was also studied here.
The study’s limitations include the high proportion of patients lost to follow-up (due to death, changes in their place of residence, “doctor-hopping”, etc.), which could have biased the study sample’s characteristics and representativeness – notably in terms of the mortality rate observed here (which was markedly lower than the literature values ).
In the future, it would be useful to take greater account of the patient’s quality of life in stroke rehabilitation programmes. Firstly, this might improve functional independence, physical independence and communication through long-term rehabilitation. Secondly, depression could be screened for and treated early, since fluoxetine remains a medication of choice in this context. Furthermore, it may also be important to encourage carers and provide them with support. To that end, involvement with stroke associations and networks may be of value in terms of organized leisure activities and patient support. In France, these measures should be promoted by the health authorities, in compliance with the country’s 2005 Handicap and Independence Act.
1.4
Conclusion
Stroke victims have a significantly poorer quality of life than the general population.
In the present study, functional independence and depression were the variables that most influenced quality of life (in agreement with the literature data). Quality of life remains difficult to predict and, in any case, is less predictable than functional status. Lastly, and in addition to these objective findings, our patient interviews suggested that other factors (such as support from family and friends) are also involved. These aspects should be further addressed by care providers.
Disclosure of interest
The authors declare that they have no conflicts of interest concerning this article.
Related posts:
 Factors influencing the awareness of diabetic foot risks
 Evaluation under real-life conditions of a stand-alone fall detector for the elderly subjects
 Submental sensitive transcutaneous electrical stimulation (SSTES) at home in neurogenic oropharyngeal dysphagia: A pilot study
 Tolerance and effectiveness on pain control of Pamidronate ®intravenous infusions in children with neuromuscular disorders
 Cancer Rehabilitation
Stay updated, free articles. Join our Telegram channel

Full access? Get Clinical Tree


