Abstract
Aim
To investigate causes of death and age at death in cerebral palsy subjects compared with the general population.
Method
Analysis of data supplied by the centre of epidemiology on the medical causes of death within the National Institute of Health and Medical Research in France was conducted. Three thousand and thirty-one death certificates indicating a diagnosis of cerebral palsy (ICD-10 code G80) were reported between 2000 and 2008.
Results
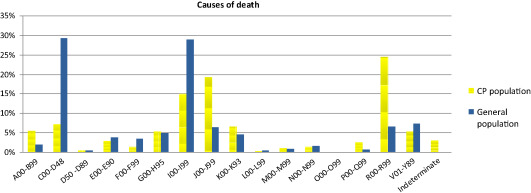
Median age at death was between 45–54 years and principal cause of death (24%) comprised the category “symptoms, signs, and abnormal results of clinical and laboratory tests, not classified elsewhere”. Of these, 66% were related to the circulatory and respiratory systems. “Diseases of the respiratory system” were the second most common cause of death (19% compared with 6% in the French general population). The third most common cause of death was “diseases of the circulatory system” (15% compared with 29% in the French general population). While deaths caused by tumour pathologies in the general population are the most common cause of deaths, these represented only 7% of deaths in subjects with cerebral palsy.
Interpretation
These results concur with other published data, i.e. subjects with cerebral palsy die younger than the French general population, and the principal causes of death are respiratory and circulatory problems. This study emphasises the importance of access to epidemiological data about the French cerebral palsy population.
Résumé
Objectif
Déterminer les causes et l’âge de décès d’une population de patients atteints de paralysie cérébrale (PC) comparée à la population générale.
Patients et méthode
Analyse des données fournies par le centre d’épidémiologie sur les causes de décès. Trois mille trente et un certificats de décès comportant le diagnostic de paralysie cérébrale de l’année 2000 à 2008 ont été répertoriés.
Résultats
L’âge médian de décès dans notre population se situe entre 45 à 54 ans. La cause principale de décès (24 %) est la catégorie : « symptômes, signes et résultats anormaux d’examens cliniques et de laboratoire, non classés ailleurs » dont 66 % concernent la catégorie symptômes et signes relatifs aux appareils circulatoire et respiratoire. Les maladies de l’appareil respiratoire sont la deuxième cause de décès (19 % contre 6 % dans la population générale). La troisième cause de décès sont les maladies de l’appareil circulatoire (15 % contre 29 % dans la population générale). Les tumeurs ne sont que la 4 e cause de décès chez les personnes atteintes de PC alors que cette catégorie est la 1ère cause de décès dans la population générale.
Discussion
Cette étude confirme ce qui est rapporté dans la littérature anglo-saxonne. Les personnes atteintes de PC meurent plus jeunes que la population générale, les causes principales de décès sont : respiratoires puis circulatoires. Elle souligne l’importance de disposer de données épidémiologiques concernant la population PC en France qui en l’absence de données fiables ne permet pas de comparer nos résultats à ceux de la littérature.
1
English version
1.1
Introduction
Cerebral palsy (CP) is the most frequent cause of motor handicap in children. The prevalence of CP is stable and it is estimated to affect 2 to 3 per 1000 births in Europe. Life expectancy of CP sufferers varies according to the severity of the motor and cognitive handicap . According to Hemming et al., 85% of CP patients who are 20 years old will survive until they are age 50 . Reid et al. reported similar figures in a study on 3507 CP patients monitored for a period of 34 years. Results showed that survival rate at age 20 years was 89%. The strongest predictive factor of mortality was no independent deambulation. Epilepsy or severe intellectual disability were additional predictive factors of mortality in this study .
Most authors report a higher mortality rate in this population compared with the general population, along with differences between the populations regarding causes of death. Hemming et al. conducted a cohort study investigating the causes of death in a population of 341 adults with CP. The findings were that the relative risk of death was higher for all ages when compared with a cohort of age-matched subjects . The most frequently reported causes of death were respiratory and circulatory diseases .
A literature search did not reveal any other French study investigating the causes of mortality in CP and therefore the aim of this study was to improve available knowledge with regard to the causes of mortality in the CP population so that preventive measures can be prioritised and implemented in the future.
This paper summarises the results of a retrospective study on the medical causes of death of CP patients over a 9-year period between 2000 and 2008, using data supplied by the “centre of epidemiology on the medical causes of death” (Cépi-Dc – INSERM). This study determined the death rate as a function of age, the different causes of death in this population and to compare these results with the known death in the French general population data.
1.2
Method
An investigation was carried out on all deaths recorded from 2000 to 2008 in which a diagnosis of CP appeared as one of the initial or associated causes of death. This was defined as code of G80 according to the International Classification of Diseases and Related Health Problems 10 (ICD-10) classification. These data were supplied by the centre of epidemiology on the medical causes of death (Cépi-Dc – INSERM) and the causes of death were classified according to the 16 ICD-10 categories ( Appendix 1 ).
Analysis initially focused on the principal causes of death, but as the study commenced, it became evident that some of these could not truly be considered as the principal causes of death. For example, CP itself should not be considered the principal cause of death as this pathology alone cannot lead to death (code ICD G80). Furthermore, traumatic injuries, poisoning and some other consequences of external factors (code ICD-10 S00 to T98), factors influencing health status, and reasons for contacting the health services (code ICD-10 Z00 to Z99) were not considered to be principal causes of death since it was not possible to make any meaningful comparisons with the general population.
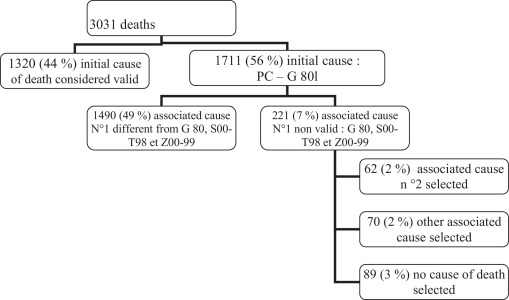
In cases where the initial cause of death was considered valid, i.e. not coded as G80, S00–T98 and Z00–Z99, then this was recorded as the principal cause of death, but if the initial cause of death was not considered valid, i.e. codes G80, S00–T98 or Z00–Z9930, then the principal causes of death were redefined. In such cases the first associated cause of death was noted and if considered valid then this was recorded as the principal cause of death. However, if the first associated cause was not considered valid, then a suitably qualified doctor studied the second and subsequent associated causes to establish what might have been the real cause of death ( Fig. 1 ).
Statistical analysis of these data and production of graphs was performed using Microsoft Excel software. It was not possible to perform a calculation of a standardised rate in the CP population as there was no information on the structure by age of the CP population in France. On the other hand, it did not initially seem possible to compare mortality rates in the CP sample population with mortality rate of the general French population. Indeed, we have no epidemiological data on the CP population living on French territory during the same period. However, we tried to go further in the analysis of data, to estimate the CP population data from the literature: the number of 125,000 people with CP was chosen .
Categorical variables were compared using the Chi 2 test, and mortality rates in the CP and general populations were compared following the guidelines issued by the Cépi-Dc. This included the use of a corrective factor as the CP population studied also comprised a sample of the reference population, so the 2 populations could not be considered independent . The level of significance was set at 5% for all statistical tests.
1.3
Results
1.3.1
Sample descriptions
A total of 3031 deaths in subjects with CP were recorded in France from 2000 to 2008 according to data supplied by Cépi-Dc. The median age range was 45 to 54 years and overall 58% of the subjects were male. On average, there were 5 deaths in subjects with CP observed from 2000 to 2008 per 100,000 inhabitants 1
1 Reference population of 2008, INSEE.
( Table 1 ).| Sample (%) | General population (%) | |
|---|---|---|
| Sex | ||
| Man | 58.1 | 51.2 |
| Woman | 41.9 | 48.8 |
| Age | ||
| < 1 an | 0.2 | 0.6 |
| 1–4 | 0.8 | 0.1 |
| 5–14 | 3.3 | 0.2 |
| 15–24 | 12.2 | 0.7 |
| 25–34 | 11.7 | 1.1 |
| 35–44 | 14.3 | 2.5 |
| 45–54 | 16.9 | 6.1 |
| 55–64 | 14.0 | 9.1 |
| 65–74 | 12.3 | 15.8 |
| 75–84 | 10.4 | 29.6 |
| 85–94 | 3.3 | 27.7 |
| 95 ans et + | 0.5 | 6.3 |
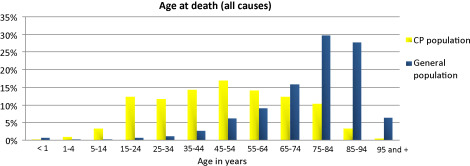
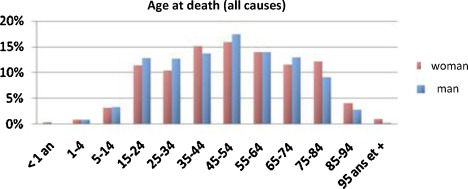
Analysis showed that CP subjects die at a younger age than the general population. The study of mortality by age group compared to the general population shows a higher mortality rate for the age range of 1–4 years than 55–64. Indeed, 92% of CP subjects dying between the ages of 15 and 84 years, compared to 65% in the general population. Whereas death usually occurs in old age in the general population, it occurs between the ages of 35 and 64 years in almost half of all CP patients ( Fig. 2 ). There was a difference statistically significant ( P = 0.002 when age was grouped by < 1 year and 1–4 years) in the distribution of deaths by age according gender people as in the general population ( P < 0.001 when death was analysed by age and gender) ( Fig. 3 ).
1.3.2
Causes of death
For 1320 (44%) of CP subjects, the documented initial cause of death was considered valid. A total of 1711 (56%) subjects had CP noted as the principal cause of death and therefore cause of death was redefined in these cases. For 1490 (87%) of these subjects, the primary associated cause was then considered to be the cause of death; for 62 (4%) of subjects, the second associated cause was selected and for 70 (4%) subjects, another associated cause was considered to be the cause of death. For 89 (5%) subjects, no cause of death could be determined based on the assumption that CP alone cannot be considered a valid cause of death ( Fig. 1 ).
Data analysis revealed differences in the distribution of the causes of death in the CP group compared with the French general population.
Higher mortality was found in the CP subjects for the category “signs, symptoms and abnormal results of clinical and laboratory tests, not classified elsewhere” (codes ICD-10 R00 to R99) which accounted for the principal cause of death in 24% of CP subjects compared to only 7% in the general population. Sixty-six percent of the causes of death in this group were as a result of circulatory and respiratory problems, with respiratory failure accounting for 63% of such cases. Therefore, 15% of the overall number of deaths in subjects with CP in our study were caused by respiratory failure categorised as “symptoms, signs and abnormal clinical and laboratory findings, not elsewhere classified”.
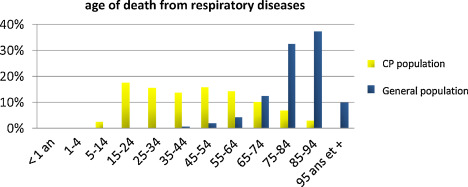
“Diseases of the respiratory system” (codes ICD-10 J00–J99) were the second most common cause of death (19% compared with 6% in the French general population). Pneumopathies were the most frequent cause of death (24.5%) in this category, acute respiratory failure: 21% and influenza: 2.4%. Subject age at death in this category was younger than found in the general population ( Fig. 4 ).
The third most common cause of death was “diseases of the circulatory system” (15% compared with 29% in the French general population). A total of 52% of deaths under this category were due to other forms of cardiopathy, with almost half (46%) being due to cardiac arrest. Cerebrovascular diseases represented 20.3% of the causes of death, while ischaemic cardiopathies accounted for 11.5%. Again, subject age at time of death was younger in our sample than in the general population ( Fig. 5 ).
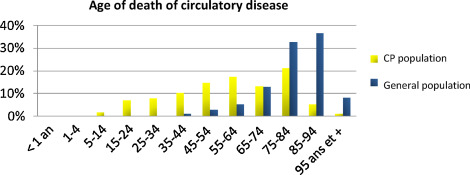
“Deaths caused by tumours” accounted for only 7% of deaths in the CP population studied and comprised the fourth most common cause of death in subjects with CP, whereas this category was the principal cause of death in the general population (29% in the French general population).
“Deaths caused by infectious and parasitic diseases” represented 5% of deaths in the CP population studied, with half of these being caused by septicaemia ( Fig. 6 ).
1.3.3
Comparison of mortality rates in the cerebral palsy (CP) population and the general population
Referring to published literature, it was estimated that there were approximately 125,000 patients with CP in France, and this figure was used to compare the mortality rates between our sample and the general population in 2008. A comparison with the general population did not show any significant increase in the mortality rate in any age bracket in the CP population, although death occurred at an earlier age in CP sufferers ( Figs. 2 and 3 , Tables 1 and 2 ). A significantly higher mortality rate was noted for the category of “poorly defined symptoms and morbid state” in the CP population compared with the general population in France. Finally, there was a trend towards a higher mortality rate for the category “congenital malformations, infectious and parasitic diseases, and diseases of the respiratory system” in subjects with CP ( Table 3 ).
| Age bracket | Raw mortality rates per 100,000 inhabitants in 2008 | Number of deaths observed in CP population in 2008 a | Number of deaths expected in CP population in 2008 b | CIM in 2008 c | P -value ( * significant) for the difference between mortality rates in the CP population and mortality rates in general population in 2008 d |
|---|---|---|---|---|---|
| < 1 year | 349.8 | 2 | 437 | 0.00 | < 0.001 * |
| 1–4 | 19.2 | 2 | 24 | 0.08 | < 0.001 * |
| 5–14 | 9.0 | 12 | 11 | 1.07 | 0.82 |
| 15–24 | 40.5 | 31 | 51 | 0.61 | 0.01 * |
| 25–34 | 61.9 | 45 | 77 | 0.58 | < 0.001 * |
| 35–44 | 134.8 | 42 | 169 | 0.25 | < 0.001 * |
| 45–54 | 354.0 | 75 | 443 | 0.17 | < 0.001 * |
| 55–64 | 720.3 | 77 | 900 | 0.09 | < 0.001 * |
| 65–74 | 1467.2 | 45 | 1834 | 0.02 | < 0.001 * |
| 75–84 | 4001.1 | 46 | 5001 | 0.01 | < 0.001 * |
| 85–94 | 11,825.4 | 20 | 14782 | 0.00 | < 0.001 * |
| 95+ years | 32189.8 | 3 | 40237 | 0.00 | < 0.001 * |
| Total | 853.9 | 400 | 1067 | 0.37 | < 0.001 * |
a Number of deaths observed in the CP sample in 2008 (Cépi-Dc files).
b Number of deaths expected: raw rate (for 100,000) × total sample in 2008.
c Comparative index of mortality = (Number of deaths observed in the CP sample in 2008 [Cépi-Dc files])/(Number of deaths expected: raw rate (for 100,000) × total sample in 2008).
d Comparison of the mortality rate observed in the CP population and the theoretical mortality rate in the general population in 2008 (use of a corrective factor).
| Code | Code heading | Raw mortality rates per 100,000 inhabitants in 2008 | Number of deaths observed in CP population in 2008 a | Number of deaths expected in CP population in 2008 b | CIM in 2008 c | P -value ( * significant) for the difference in the mortality rate between the CP population and the general population in 2008 d |
|---|---|---|---|---|---|---|
| A00–B999 | I. Infectious and parasitic diseases | 17.1 | 24 | 21 | 1.12 | 0.57 |
| C00–D489 | II. Neoplasms | 254.0 | 37 | 318 | 0.12 | < 0.001 * |
| E00–E90 | IV. Endocrine, nutritional and metabolic diseases | 31.2 | 18 | 39 | 0.46 | 0.001 * |
| F00–F99 | V. Mental and behavioural disorders | 28.0 | 5 | 35 | 0.14 | < 0.001 * |
| G00–H959 | VI. Diseases of the nervous system and the sensory organs | 49.2 | 20 | 62 | 0.33 | < 0.001 * |
| I00–I99 | VII. Diseases of the circulatory system | 235.1 | 51 | 294 | 0.17 | < 0.001 * |
| J00–J998 | VII. Diseases of the respiratory system | 52.5 | 77 | 66 | 1.17 | 0.16 |
| K00–K938 | IX Diseases of the digestive system | 37.8 | 20 | 47 | 0.42 | < 0.001 * |
| M00–M999 | XI. Diseases of the musculoskeletal system and connective tissue | 5.9 | 3 | 7 | 0.41 | 0.11 |
| N00–N999 | VII. Diseases of the genito-urinary system | 14.5 | 8 | 18 | 0.44 | 0.02 * |
| Q00–Q999 | XV. Congenital malformations | 2.3 | 5 | 3 | 1.74 | 0.21 |
| R00–R99 | XVI. Poorly defined symptoms and morbid states | 58.9 | 112 | 74 | 1.52 | < 0.001 * |
| V01–Y899 | XVII. External causes | 59.1 | 11 | 74 | 0.15 | < 0.001 * |
| Total | 853.9 | 400 | 1067 | 0.37 | < 0.001 * |
a Number of deaths observed in the CP sample in 2008 (all ages) (Cépi-Dc files).
b Number of deaths expected: raw rate (for 100,000) × total sample in 2008 (including all ages and sexes).
c Comparative index of mortality = (Number of deaths observed in the CP sample in 2008 [all ages] [Cépi-Dc files])/(Number of deaths expected: raw rate [for 100,000] × total sample in 2008 [including all ages and sexes]).
d Comparison of the mortality rate observed in the CP population and the theoretical mortality rate in the general population in 2008 (use of a corrective factor).
Stay updated, free articles. Join our Telegram channel

Full access? Get Clinical Tree


