Advanced Needle EMG Methods
Erik Stålberg
Introduction
The organization of muscle fibers within the motor unit (MU) changes in typical ways in different nerve and muscle disorders. Many forms of neurogenic conditions are characterized by collateral sprouting from intramuscular nerve branches of surviving MUs. This increases the number of muscle fibers in individual MUs (1). In the reinnervated MU, the fibers of the same MU are found to be clustered together instead of being randomly distributed, as in the healthy patient. In muscle biopsy, this is seen as “fiber-type” grouping (2,3).
In primary myopathies, on the other hand, degeneration of individual fibers causes a reduced number of muscle fibers within a MU. In addition, there is often muscle fiber regeneration and fiber splitting; these tend to increase the number of muscle fibers, which now occur in small clusters (4). Fibrosis will further change the local topography of muscle fibers within a MU. In myopathies there is often an increased variation in diameter of muscle fibers, from reduced to some large muscle fibers.
These types of MU changes can be studied not only with morphologic techniques, as referred to here, but also by electrophysiologic methods. The electromyography (EMG) signals are dependent upon the number of muscle fibers, the local concentration and sizes of the fibers, and neuromuscular and axonal transmission of action potentials. The EMG signal is also affected by the type of electrode used for recording (Fig. 6-1).
Conventional EMG Recordings
In conventional EMG, concentric or monopolar electrodes are used. With some differences in the shape and size of the active recording zone, they record electrical signals from active muscle fibers within a radius of 2 to 3 mm (5). This recording zone is small compared to the size of the entire MU, which has a “territory” typically 3 to 10 mm in diameter. On the other hand, it is too large to allow the selective recording from just one or a few muscle fibers for detailed analysis. The amplitude of the normal MU potential (MUP) may be determined by one to four fibers closest to the tip, and the duration of the MUP is determined by approximately 30 fibers within the 2 to 3 mm recording zone. Still, this technique is of great value in the study of MU characteristics that differentiate normal from myogenic and neurogenic disorders. The MUP analysis is becoming quantitative and automatic. We have developed a technique by which up to six different MUPs are recorded from each recording site; this method, called multi-MUP recording (Fig. 6-2) (6), is based on decomposition algorithms. This algorithm recognizes and extracts the individual elements (MUPs) that occur repeatedly, each time with the same shape. In this way a given MUP can be identified even when superimposed with activity from other MUs. The decomposition can be more or less complete, depending upon clinical or experimental application. If an exact firing (recruitment) pattern
should be studied, a complete decomposition is necessary. If the aim is to quantitate MUP parameters, it is not necessary that each discharge be identified. Our multi-MUP method is optimized in speed and accuracy for daily routine use. Similar methods have been developed by others (7). Reference values have been collected for a number of muscles (8), parameters have been added to improve the detection of pathology, and a new way to express abnormality has been defined (9).
should be studied, a complete decomposition is necessary. If the aim is to quantitate MUP parameters, it is not necessary that each discharge be identified. Our multi-MUP method is optimized in speed and accuracy for daily routine use. Similar methods have been developed by others (7). Reference values have been collected for a number of muscles (8), parameters have been added to improve the detection of pathology, and a new way to express abnormality has been defined (9).
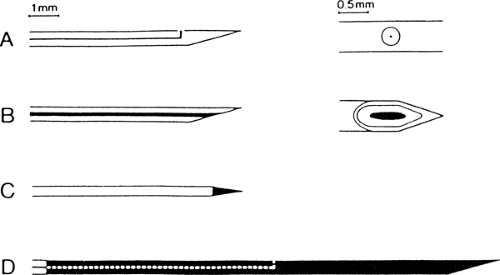 Figure 6-1 • Different types of EMG electrodes. A. Single fiber EMG electrode with one recording surface. B. Concentric needle electrode. C. Monopolar electrode. D. Macro electrode. |
In neurogenic conditions, the MUPs are typically of increased duration and amplitude because of the grouping of muscle fibers within the MU. In addition, they often change in shape at consecutive discharges (referred to as “jiggle”) (10), particularly during the phase of ongoing reinnervation.
In myopathies, there is a reduction of duration owing to loss of muscle fibers and fibrosis. Furthermore, in both neurogenic and myopathic conditions, there is often an increased number of complex or polyphasic MUPs. These complex MUPs are due to an increased variation among pathologic muscle fiber diameters, causing a wider range of conduction velocities (along muscle membranes), and to some degree are due to the scattered positions of endplates after reinnervation. These two phenomena produce increased temporal dispersion among individual single-fiber action potentials, causing the typical changes in MUP shape (11). Recordings with conventional needle electrodes do not provide information about the size of the MU in terms of the number of total number of muscle fibers or territory.
Other EMG methods, both more and less selective, have been developed to complement the conventional recordings. This chapter describes three of these special techniques. The classic EMG method is presented in other chapters of this book.
Single-Fiber EMG
In certain cases, essential information may be obtained by the detailed study of just one or a few muscle fibers from one MU. Examples of this include the study of neuromuscular transmission in individual endplates and investigations of the distribution of muscle fibers in the MU. For this purpose, single-fiber EMG (SFEMG) was developed. After being proven valuable in these situations, SFEMG has taken its place in clinical routine work and will be described briefly here. The interested reader is referred to additional literature on the topic (12,13,14,15).
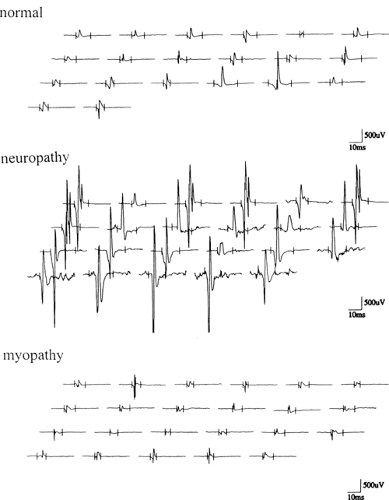 Figure 6-2 • MUP recordings from normal, neuropathic, and myopathic muscles using multi-MUP analysis technique. |
SFEMG is based on extracellular recordings of single muscle fiber action potentials with a small electrode (25 μm in diameter), exposed in a side port of a steel cannula 0.5 mm in diameter. Because of the small area of the recording surface and the reduced amplifier filter bandwidth (set to 500 Hz to 10 KHz), the recording zone is limited to a hemisphere with a radius of about 300 μm, resulting in high spatial resolution. On consecutive discharges, a given single-fiber action potential has a well-defined and reproducible shape that justifies time measurements with accuracy as high as 0.1 ms.
These recording advantages have been used over the years to study a number of morphologic and functional details in the MU. These studies range from studies of propagation of action potentials along single muscle fibers, membrane characteristics, neuromuscular transmission of individual motor endplates, local organization of muscle fibers in a MU, discharge characteristics of ventral horn cells, and conduction in corticospinal tract axons. This chapter describes studies of the neuromuscular transmission and of local muscle fiber distribution.
Neuromuscular Transmission
Methods
Voluntary Activation
The neuromuscular transmission is most commonly studied during slight voluntary contraction. The electrode is inserted into the muscle and a position is sought where two muscle fibers from the same MU (i.e., discharging synchronously) are recorded. When triggering the oscilloscope sweep on one of the spikes in the potential pair, the interpotential latency to the other varies during consecutive discharges. This variation of the interpotential intervals is called “jitter.” This is due to the summated variability of neuromuscular junction transmission time in the two motor endplates involved in the recordings (Fig. 6-3).
Intramuscular Stimulation
Also used for these studies is microstimulation of individual muscle fibers and motor axons, either inside the muscle or in the nerve trunk. A small monopolar electrode is used as a cathode and a surface electrode is used as an anode for intramuscular stimulation. Stimulation strength is usually kept below 10 mAmp and stimulus pulse duration is typically 0.05 ms. Recording is through a SFEMG electrode about 20 mm away from the stimulation point. If a muscle fiber is directly stimulated, the jitter is less than 4 ms, but if an intramuscular axon is stimulated, the jitter is more than 4 ms because of the involvement of the synapse at the motor endplate (Fig. 6-4). Using this method, the neuromuscular junction can be studied under well-standardized conditions and over long periods of time. The method can also be used with uncooperative patients, comatose patients, patients with movement disorders, infants, or other situations in which voluntary patient activation is difficult. The technique can also be used in animal experiments.
 Figure 6-3 • A. Schematic presentation of jitter recording during voluntary contraction. B. Two single-fiber action potentials from fibers of the same MU recorded at high speed. The sweep is triggered by the first action potential. Several discharges are superimposed, demonstrating the variability of the interpotential interval, the neuromuscular jitter. (Reprinted with permission from Stålberg E, Trontelj JV. Single fiber electromyography in healthy and diseased muscle, 2nd ed. New York: Raven Press, 1994. ) |
Calculation of Jitter
Jitter is expressed as the mean value of the difference between consecutive interpotential intervals
(in absolute values). In stimulation studies, the interval between stimulus artifact and the resulting single-fiber action potential is used for calculations. Jitter was initially calculated from superimposed filmed recordings, but modern EMG instruments can automatically calculate jitter.
(in absolute values). In stimulation studies, the interval between stimulus artifact and the resulting single-fiber action potential is used for calculations. Jitter was initially calculated from superimposed filmed recordings, but modern EMG instruments can automatically calculate jitter.
 Figure 6-4 • Intramuscular stimulation. A. Stimulating and recording electrodes (upper). Examples of typical responses with direct muscle fiber stimulation (low jitter) and with axonal stimulation having jitter greater than 4 ms (middle). B. Dual distribution of jitter values in the extensor digitorum communis muscle corresponding to direct and axonal stimulation. Dividing line is at 5 μs. (Reprinted with permission from Stålberg E, Trontelj JV. Single fiber electromyography in healthy and diseased muscle, 2nd ed. New York: Raven Press, 1994. ) |
Neuromuscular Transmission in Healthy Subjects
Jitter during Voluntary Activity
The jitter during voluntary activation is approximately 5 to 60 μs, depending on the muscle and the patient’s age (Table 6-1). Motor endplates
within the same MU have different jitter values. The jitter does not show any appreciable change for up to 10 minutes of continuous activity with a mean rate of about 10 Hz. In a study of the safety factor (16) of individual endplates using regional curare, it was found that those with higher jitter were more sensitive to curare than those with initially low jitter. Thus, it seems justified to say that the jitter reflects the safety factor (amount of acetylcholine [ACh] released in excess of that required for the synapse) of transmission in individual motor endplates.
within the same MU have different jitter values. The jitter does not show any appreciable change for up to 10 minutes of continuous activity with a mean rate of about 10 Hz. In a study of the safety factor (16) of individual endplates using regional curare, it was found that those with higher jitter were more sensitive to curare than those with initially low jitter. Thus, it seems justified to say that the jitter reflects the safety factor (amount of acetylcholine [ACh] released in excess of that required for the synapse) of transmission in individual motor endplates.
Table 6-1 Jitter Reference Values for Various Age Groups from a Multicenter Study (18) | ||||||||||||||||||||||||||||||||||||||||||||||||||||||||||||||||||||||||||||||||||||||||||||||||||||||||||||||||||||||||||||||||||||||||||||||||||||||||||||||||||||||||||||||||||||||||||||||||||||||||||||||||||||||||||||||||||||||||||||||||||||||||||||||||||||||||||||||
|---|---|---|---|---|---|---|---|---|---|---|---|---|---|---|---|---|---|---|---|---|---|---|---|---|---|---|---|---|---|---|---|---|---|---|---|---|---|---|---|---|---|---|---|---|---|---|---|---|---|---|---|---|---|---|---|---|---|---|---|---|---|---|---|---|---|---|---|---|---|---|---|---|---|---|---|---|---|---|---|---|---|---|---|---|---|---|---|---|---|---|---|---|---|---|---|---|---|---|---|---|---|---|---|---|---|---|---|---|---|---|---|---|---|---|---|---|---|---|---|---|---|---|---|---|---|---|---|---|---|---|---|---|---|---|---|---|---|---|---|---|---|---|---|---|---|---|---|---|---|---|---|---|---|---|---|---|---|---|---|---|---|---|---|---|---|---|---|---|---|---|---|---|---|---|---|---|---|---|---|---|---|---|---|---|---|---|---|---|---|---|---|---|---|---|---|---|---|---|---|---|---|---|---|---|---|---|---|---|---|---|---|---|---|---|---|---|---|---|---|---|---|---|---|---|---|---|---|---|---|---|---|---|---|---|---|---|---|---|---|---|---|---|---|---|---|---|---|---|---|---|---|---|---|---|---|---|---|---|---|---|---|---|---|---|---|---|---|---|---|---|
| ||||||||||||||||||||||||||||||||||||||||||||||||||||||||||||||||||||||||||||||||||||||||||||||||||||||||||||||||||||||||||||||||||||||||||||||||||||||||||||||||||||||||||||||||||||||||||||||||||||||||||||||||||||||||||||||||||||||||||||||||||||||||||||||||||||||||||||||
It has been discussed whether neuromuscular blockade owing to local ischemia might be one of the reasons for muscular fatigue in normal muscle that develops during prolonged activity. In a study with ischemia after the inflation of a sphygmomanometer cuff around the upper arm, jitter was measured in the extensor digitorum communis muscle activated voluntarily (17). Following a few minutes of continuous activity during ischemia, the jitter started to increase fairly rapidly and one or the other of the potentials showed intermittent blocking, at first rarely and then more frequently until total block occurred. The time to blocking was shorter with higher innervation rates. Approximately 2,000 to 4,000 discharges were required before the onset of blocking. After release of the cuff, the transmission recovered quickly and jitter became close to normal within a few minutes.
Jitter during Electrical Stimulation
The method is described in detail elsewhere (12,14). Because only one motor endplate is involved, normal jitter during electrical stimulation is lower than with voluntary activation. Theoretically, the values are reduced on average by a factor of √2 lower. This is in accordance with experimental results. In muscles in which separate reference values at electrical stimulation are missing, those from voluntary activation can be used after dividing by √2.
Most normal endplates display rather constant jitter at different stimulation rates within the range of physiologic firing frequencies, reflecting a high safety factor. This has been studied in some detail (12). At a 50 Hz stimulation rate, a substantial increase in jitter occurred in comparison to the jitter values at 10 Hz in over two thirds of the studied motor endplates of healthy subjects. However, it still did not exceed the upper normal limit for 10 Hz (40 μs) in any of the tested endplates. This suggests a remarkable ability of the presynaptic terminals to cope with the increased demand for ACh synthesis and mobilization even at these high rates.
Normal Jitter Values
Normal jitter values in Table 6-1 are based on data from a multicenter study, which includes values from our laboratory (18). Until the individual laboratory has collected its own reference values, these values can be used. Jitter values are extremely reproducible when the standard instrumentation protocols are followed.
Jitter: Voluntary Activation
Jitter is expressed as the mean value of consecutive differences (MCD) of interpotential intervals. In a multispike recording occurring in a high-fiber-density situation, only MCD values between one triggering component and each of the other components is measured: that is, when four spikes are present, three MCD values are obtained.
Abnormality is expressed in two ways:
By marking the number of recordings with jitter outside given limits for individual data. If 2 or more recordings in a set of 20 exceed the limit, the finding is considered abnormal.
By the mean MCD value for the whole study in a muscle. The distribution of individual jitter values in abnormal conditions is often skewed, with some extremely high values. Therefore, the mean MCD is calculated only from data with a jitter value less than 150 μs (unless a majority of data are abnormal and distributed near this limit).
Examples of normal values for the extensor digitorum communis from a multicenter study (18) that indicates the preference limit for mean MCD and individual jitter values are shown in Figure 6-5. For more information on reference values for these and other muscles, the reader is referred to a comprehensive text on the subject (12).
Jitter: Axonal Stimulation
The principles given in descriptions on SFEMG electrical stimulation must be strictly adhered to in order to avoid pitfalls leading to potentially
serious errors. A minimum of 20 to 30 endplates are sampled with two or more different positions of the stimulating needle. The abnormality is expressed in the same way as in the voluntary jitter study (as a number or percentage of the abnormal recordings and as the mean of all individual MCD values in the study). One out of 20 values above the upper reference limit is accepted in a normal muscle.
serious errors. A minimum of 20 to 30 endplates are sampled with two or more different positions of the stimulating needle. The abnormality is expressed in the same way as in the voluntary jitter study (as a number or percentage of the abnormal recordings and as the mean of all individual MCD values in the study). One out of 20 values above the upper reference limit is accepted in a normal muscle.
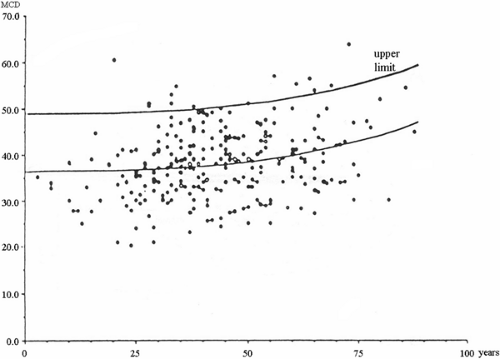 Figure 6-5 • Graph showing third-highest individual jitter value in each subject (extensor digitorum communis [EDC]) plotted against age. The upper line corresponds to 95% confidence limits and is used as upper normal limits for individual data from 20 recordings in an EDC muscle. (Reprinted with permission from Gilchrist J, Barkhaus PE, Bril V, et al. Single fiber EMG reference values: a collaborative effort. Muscle Nerve 1992;15:151–161. ) |
Jitter Studies with Monopolar or Concentric Needle Electrodes
It has been frequently asked whether conventional EMG needle electrodes can be used for SFEMG. For fiber density assessment the answer is no, since the electrodes have a larger uptake area than the SFEMG electrode and since action potentials from individual fibers sometimes interfere and cannot be viewed separately. For jitter measurements, experience has shown that it is possible to obtain reasonably appropriate estimates. The filters should be set to a bandwidth of 1,000 (or even 2,000) Hz to 10 kHz. Some components may superimpose and the jitter may be underestimated, or occasionally slightly overestimated. If separate spike components are chosen for trigger and for measurements, then the jitter values are similar for this type of recording and the SFEMG electrode. In a study of 10 myasthenic patients, the authors found no significant difference in the values, and the interpretation was the same independent of the electrode used (19). The recording quality is actually better with a disposable concentric needle electrode than with a SFEMG electrode that has been left without maintenance
to keep the recording surface clean and the tip sharp. The most selective recording is still obtained with a SFEMG electrode of good quality.
to keep the recording surface clean and the tip sharp. The most selective recording is still obtained with a SFEMG electrode of good quality.
Neuromuscular Transmission in Disease
Myasthenia Gravis
The principal neurophysiologic mechanisms and corresponding structural changes underlying the transmission defect in myasthenia gravis (MG) are well known (20). The endplate potential (EPP) amplitude is reduced because of blocked, destroyed, or displaced postsynaptic ACh receptors, whereas the number of ACh quanta released from the presynaptic terminal per nerve impulse is normal. The resulting reduction of the safety factor (the normal excess of receptors) for neuromuscular transmission with slowly rising EPPs causes an increase in jitter values. When the EPPs are insufficient to reach the threshold for the action potential firing, then impulse blocking occurs, thus giving rise to clinical weakness as there is no depolarization of the affected muscle fibers.
Related posts:
 Electrophysiology
Basic Nerve Conduction Techniques
Quality Improvement and Reporting in Electrodiagnostic Medicine
Pictorial Guide to Muscles and Surface Anatomy
Pictorial Guide to Nerve Conduction Techniques
Neuromuscular Complications of Critical Illness: Evaluation of the Patient with a Suspected Critical Illness Neuromuscular Disorder
Electrophysiology
Basic Nerve Conduction Techniques
Quality Improvement and Reporting in Electrodiagnostic Medicine
Pictorial Guide to Muscles and Surface Anatomy
Pictorial Guide to Nerve Conduction Techniques
Neuromuscular Complications of Critical Illness: Evaluation of the Patient with a Suspected Critical Illness Neuromuscular Disorder
Stay updated, free articles. Join our Telegram channel

Full access? Get Clinical Tree


