Foot Segmental Relationships and Bone Morphology
WILLIAM H. SANNER AND KENDRICK A. WHITNEY
The purpose of this chapter is to provide a basic understanding and basis for interpretation of the mechanics represented by weight-bearing foot radiographs. This chapter also demonstrates how radiographs can be used to complement the physical, biomechanical (range of motion and morphologic observations), and gait analysis portions of an examination. Two basic radiographic views are used for mechanical evaluation of feet: dorsoplantar and lateral.
Both radiographic views have value for assessing biomechanics of the foot. The dorsoplantar view provides information primarily about transverse plane relationships seen in the foot.1–4 Any transverse plane foot deformity or transverse plane component of compensation by the foot can be observed with a dorsoplantar view. The lateral view provides information primarily about sagittal plane structural relationships and compensation within the foot. Together the dorsoplantar and lateral radiographs are used to infer frontal plane relationships.
The lateral and dorsoplantar radiographs are performed with the patient in the relaxed calcaneal stance. In other words, the major requirements for weight-bearing dorsoplantar and lateral views are that the patient be standing in his or her angle and base of gait and that the foot be appropriately placed relative to the image receptor2,3 (see Chapter 4). Failure to position the patient properly significantly alters the information provided by the radiograph.5,6
Specialty views also allow the clinician to make specific assessments. Examples are the sesamoid axial and anterior axial views.
When using radiographs to assess the mechanics and morphology of a foot, the clinician must keep in mind that each radiograph depicts osseous alignments and shapes that represent the net result of a variety of influences on the foot. For example, genetic information influences bone shape, which creates a variety of normal and abnormal interacting forces (such as functional equinus, forefoot valgus, muscle strength, and weight of the individual). Therefore, radiographs infer foot mechanics and the morphologic influences that affect foot mechanics but do not absolutely represent specific morphologic types. Foot radiographs are not a substitute for examination of the patient and are meaningful only when the radiographic and physical exams correlate. The wise clinician uses radiographs as a supplement, not a substitute, to the physical exam and treats people, not radiographs.7
This chapter seeks to provide the clinician with insights as to the most common radiographic representations of foot alignment and mechanics. Basic tools are reference lines, angles, and the alignment of its individual bones. Reference lines are created so as to measure the relationship of a foot segment or bone to another or to the supporting surface. As with position and motion, the distal segment is described relative to the proximal segment. Angles made by the reference lines between segments and bones are an indication of foot alignment. Bone and joint shape are the result of ontogeny and the forces acting on the bones. The angles, shapes, and relative position of one bone to another as represented in the radiograph allow clinicians to judge static foot mechanics and the influence of dynamic forces acting on the foot during ambulation.
DORSOPLANTAR RADIOGRAPHIC ANALYSIS
Longitudinal Axis of the Rearfoot
The longitudinal axis of the rearfoot (Figure 13-1) is a reference line also known as the longitudinal axis of the calcaneus.1,2,8 On the dorsoplantar radiograph, a dot is placed in the center of the posterior surface of the calcaneus and at the anterior medial edge of the calcaneus. A straight edge is used to connect these two points, the line being equivalent to the longitudinal axis of the rearfoot. The difficulty with this method is that the posterior aspect of the calcaneus is obscured. In this case, the clinician uses the lateral border of the anterior calcaneus to aid in drawing this axis and should then refer to it as the longitudinal rearfoot reference line.9 The lateral calcaneal border is approximately parallel to the longitudinal rearfoot axis. This line should parallel the longitudinal bisection of the fourth metatarsal.2 The longitudinal axis of the rearfoot has traditionally been considered a stable reference to which other parts of the foot should be compared.1 A good argument can be made for the talus being the major reference point of the foot, because the talus is more proximal and stable.10
The distal calcaneal articular surface should be facing anteriorly so that the cuboid is not placed in an abducted position.
Longitudinal Axis of the Talar Neck and Head
The longitudinal axis of the talar neck and head (Figure 13-1) is a reference line that represents the leg. To draw the longitudinal axis of the talar neck and head, two sets of points must first be plotted. Two points are marked at the medial and lateral margins of the head’s articular surface, which correspond to the widest dimension of the talar head. A third point is then plotted at the exact midpoint of a line connecting the two points. The second set of points is marked at the proximal extent of the talar neck medially and laterally. A second line is drawn connecting these two points, and a third point is marked at its exact midpoint. The two midpoints are then connected, and the resulting line is the longitudinal axis of the talar neck and head.1,2 The longitudinal axis of the talar neck and head extends distally and should be an approximate longitudinal bisection of the first metatarsal.2 The longitudinal axis of the talar neck and head should be the proximal reference line to which more distal segments of the foot are compared for the purpose of assessing foot linearity and stability. The longitudinal axis of the rearfoot (calcaneus) has traditionally been the proximal reference.
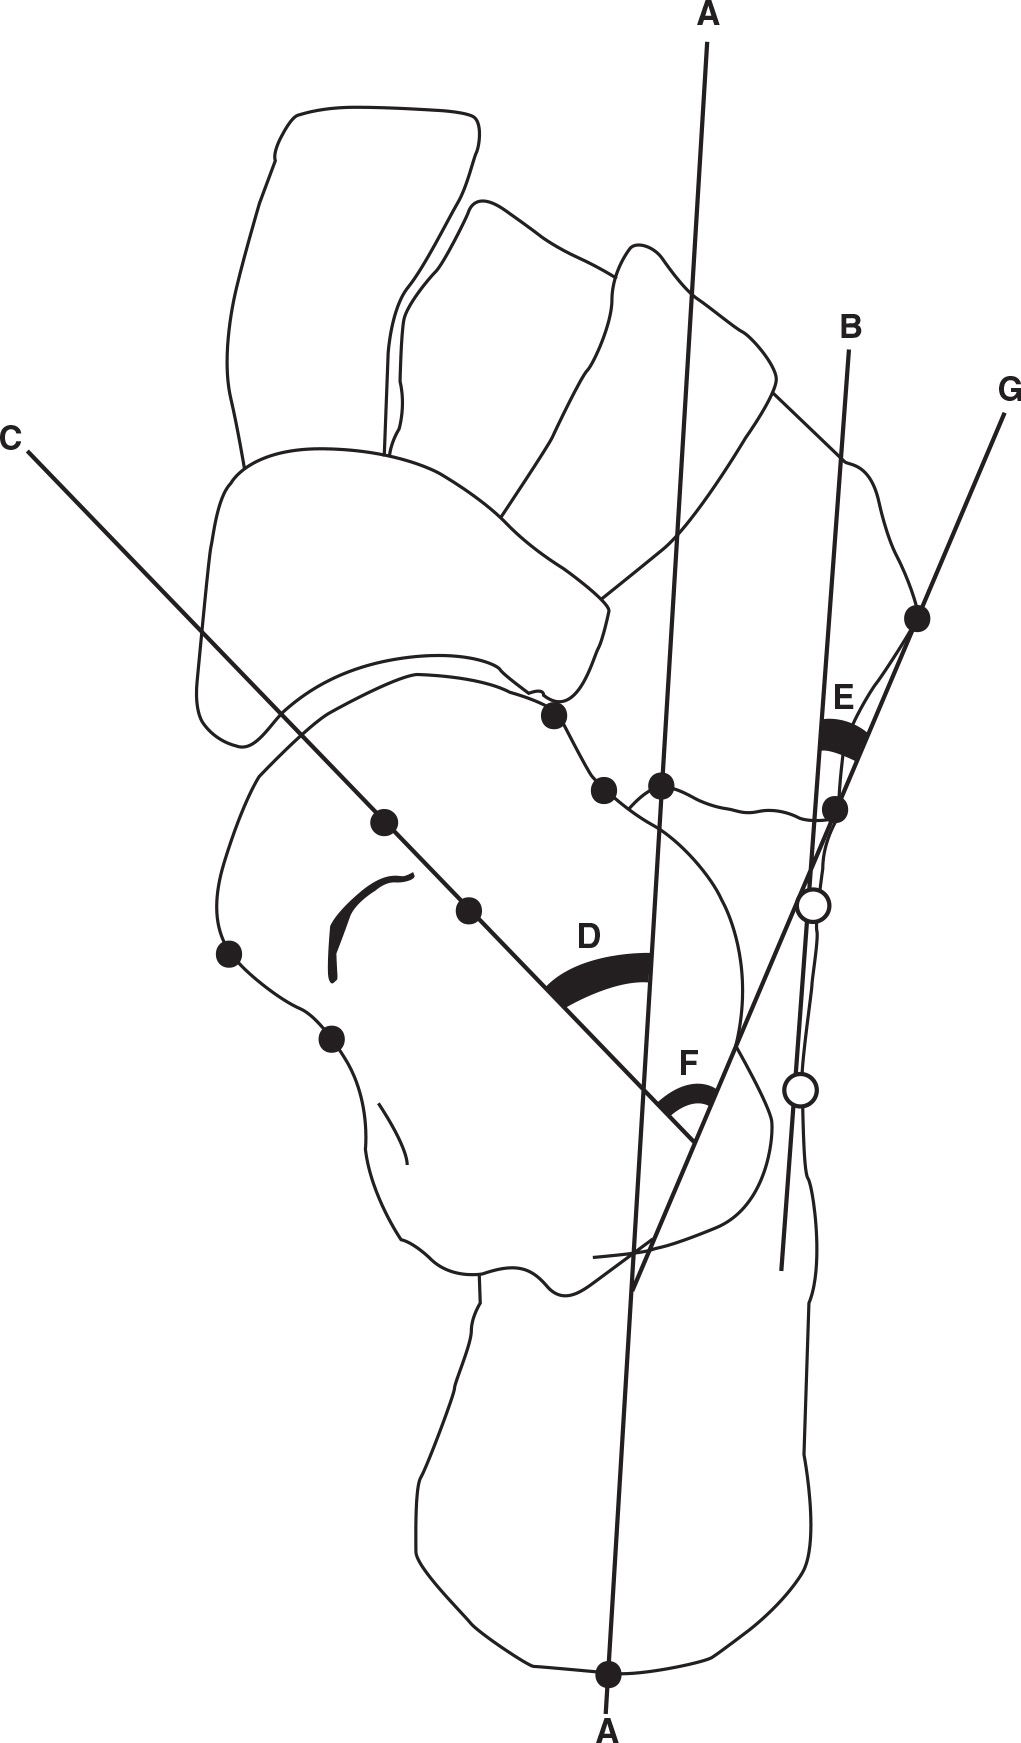
FIGURE 13-1. Rearfoot axes and angles, dorsoplantar view. Longitudinal axis of the rearfoot (calcaneus) (A); alternative longitudinal rearfoot reference line (parallel to lateral calcaneus and denoted by white/open circles) (B); longitudinal axis of talar neck and head (C); talocalcaneal angle (D); calcaneocuboid angle (E); talocuboid angle (F); cuboid axis (G).
The bisection of the talar neck and head is adducted slightly from the body of the talus and is not perpendicular to the ankle joint axis. This adduction is necessary for the talus to be the proximal end of the foot’s medial column so that it is well aligned for compression from the first metatarsal.
Longitudinal Axis of the Lesser Tarsus
The longitudinal axis of the lesser tarsus (Figure 13-2) is a reference line representing the general orientation of the midfoot in the transverse plane.1,2,7 A point is first drawn at the anterior lateral extent of the calcaneus and a second point is drawn at the lateral proximal corner of the base of the fourth metatarsal. A line is then drawn connecting these two points and the midpoint of this line is then found and marked. Next, a point is placed on the talus at the anterior medial aspect of the effective talar articular surface with the navicular. A second medial point is drawn at the proximal medial corner of the base of the first metatarsal. The midpoint of a line connecting the talar and first metatarsal points is then determined and marked. Next the midpoint dots of the medial and lateral lines are connected with a line, which is called the “transection of the midfoot.” Finally, a line is drawn perpendicular to the transection line, which is then termed the longitudinal axis of the lesser tarsus. A longitudinal bisection of the second cuneiform is approximately parallel with the longitudinal axis of the lesser tarsus (Figure 13-2).11
The longitudinal axis of the lesser tarsus is used to assess the linearity of the lesser tarsus relative to the segments proximal and distal.
Longitudinal Axis of the Metatarsus (and Forefoot)
The longitudinal axis of the metatarsus is a longitudinal bisection of the second metatarsal (Figure 13-2), which serves as a reference line representing the orientation of the metatarsals and forefoot in the transverse plane.1,2,7 The second metatarsal is used because it is the most stable metatarsal and its position is the least variable. The other metatarsals flare away from the second metatarsal.
Classical anatomic definition defines motion moving toward the second metatarsal as adduction and motion moving away as abduction. This explains the name of the hallux adductus and abductus muscles. Radiographic analysis uses the midsagittal plane of the body as the central reference. Therefore, the term metatarsus primus adductus (MPA) means that the first metatarsal is positioned toward the midline of the body and away from the second metatarsal.
The first line that is drawn to determine the longitudinal axis of the metatarsus is one that extends across the junction between the proximal diaphysis and base of the second metatarsal. The midpoint of this line is then determined and marked. A second line is then drawn across the neck of the second metatarsal, and the midpoint of this line is then connected to the midpoint of the proximal line. The line that connects the bisections of the base and neck of the second metatarsal is termed the longitudinal axis of the metatarsus (and the longitudinal axis of the forefoot).
The longitudinal axis of the metatarsus (and forefoot) is used as a reference for the orientation of these segments relative to the distal and proximal segments.
Longitudinal Axis of the Digits
Lines are also used to chart the longitudinal axis of the digits relative to the metatarsals.1,2,7 The longitudinal bisection of the proximal phalanx of the second toe is used as the longitudinal axis of the digits (Figure 13-2). The first of the lines is drawn across the base of the second proximal phalanx after which a second line is drawn across the neck of this phalanx. The midpoints of the head and base of the proximal phalanx are connected and the resulting line is the longitudinal axis of the digits.
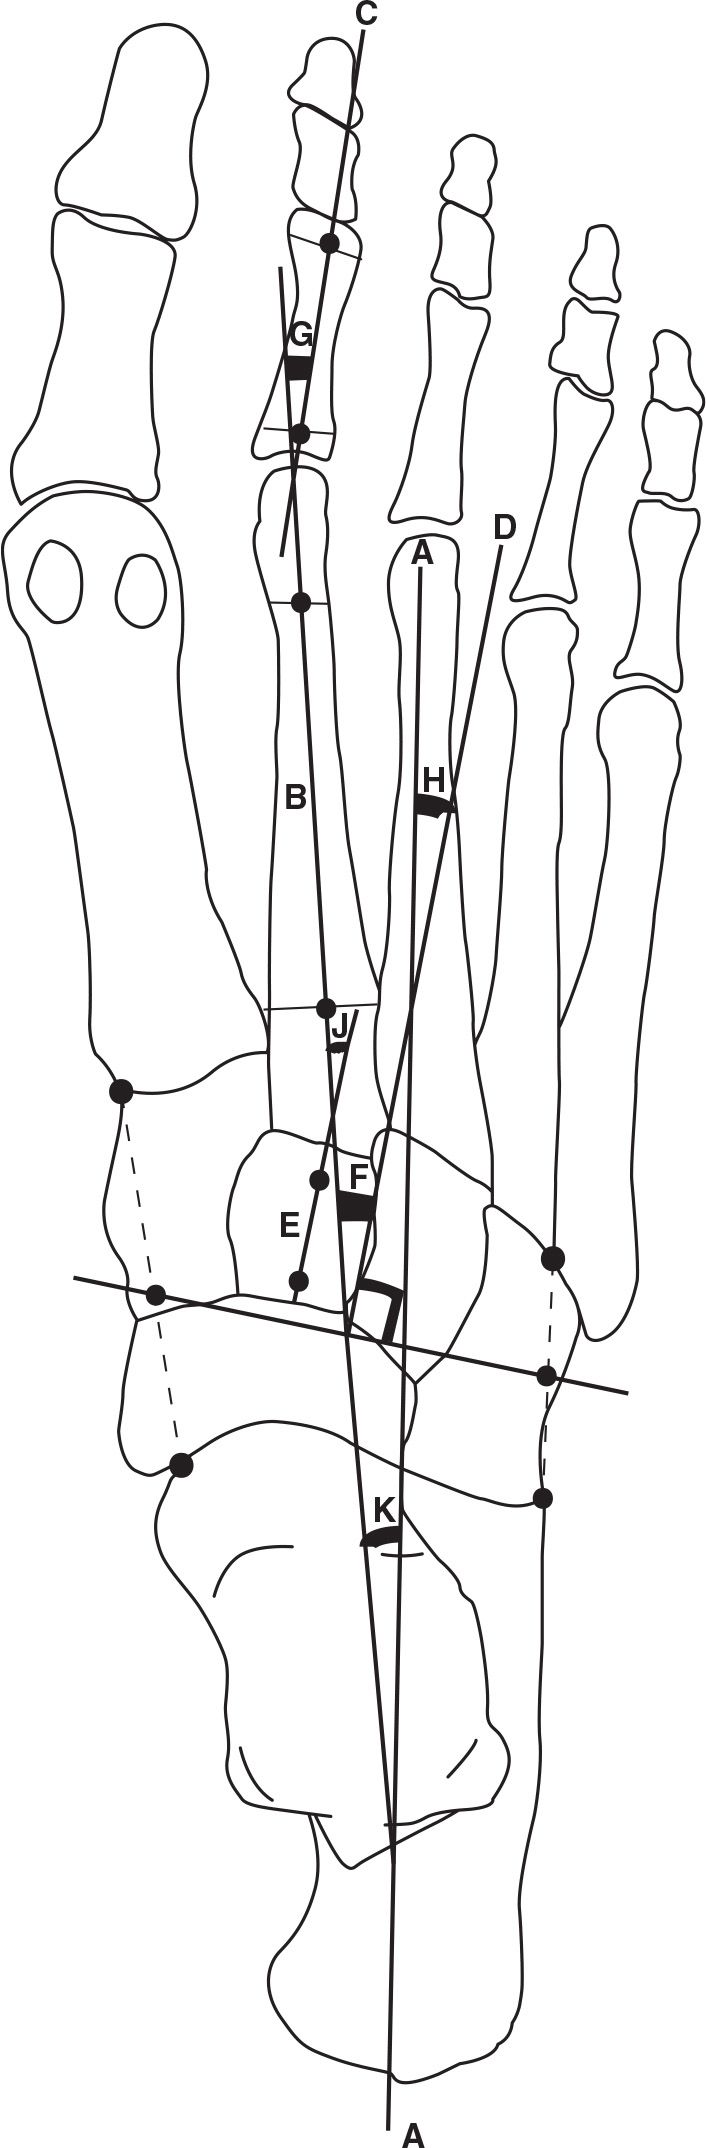
FIGURE 13-2. Forefoot/midfoot axes and angles, dorsoplantar view. Longitudinal axis of rearfoot (A); longitudinal axis of metatarsus and forefoot (B); longitudinal axis of the digits (C); longitudinal axis of the lesser tarsus, a line perpendicular to the transection of the midfoot (D); longitudinal bisection of the second cuneiform (E); metatarsus adductus angle (F); digital angle (G); lesser tarsus angle (H); Engle’s angle (J); forefoot angle (K).
The longitudinal axis of the digits is usually approximately parallel to the longitudinal axis of the rearfoot.
Talocalcaneal Angle
The talocalcaneal angle is defined as the angulation made between the longitudinal axis of the rearfoot and the longitudinal axis of the talar neck and head.1,2,7,12,13 This angle (Figure 13-1) is a transverse plane representation of subtalar position. Normally, it is approximately 15° to 18°. If the lateral border of the calcaneus is used as the longitudinal reference line of the rearfoot, the normal range for the talocalcaneal angle increases to 20° to 23°.14 Weissman7 reports 17° to 21° as normal, and based on linearity for stability, this appears a reasonable range as compared to Rowland et al.’s14 range of 20° to 23°.
The talus “corkscrews” around the sustentaculum tali as it adducts, plantarflexes and inverts during subtalar pronation, and it abducts, dorsiflexes and everts during supination.1,15 With closed kinetic-chain motion the talus moves while the calcaneus remains relatively immobile, but the calcaneus does pivot slightly on its medial tubercle to accommodate midtarsal motion.16 Such subtalar pronation results in the longitudinal axis of the talar neck and head pointing more toward the midline of the body and away from the longitudinal axis of the rearfoot, thereby increasing the talocalcaneal angle. The opposite is true during dorsiflexion and abduction of the talus: When the subtalar joint supinates, the two axes move closer together and the angulation decreases.
Although the talus does adduct and plantarflex relative to the calcaneus in closed kinetic-chain pronation, an argument can be made conceptually that the foot has abducted relative to the talus.17 This change in description of the same motion is helpful when considering reconstruction of a flatfoot.
The foot is realigned relative to the talus and not the calcaneus. Because the talus moves in closed kinetic-chain foot mechanics and the calcaneus appears stable, the calcaneus has heretofore been erroneously used as the most proximal reference bone of the foot, but the calcaneus does rotate in the transverse plane as the result of midtarsal motion.16
An increase in the talocalcaneal angle means that the ankle’s plane of motion cannot be oriented in the same general direction as the foot. This reduces the efficiency with which the foot can act as a lever for the ankle and places excess stress on the foot because the foot joints are forced to perform functions not consistent with their design. As the talocalcaneal angle increases, the head of the talus can be seen protruding medially when the foot is observed in a weight-bearing position.
The Lesser Tarsus Angle
The lesser tarsus angle (Figure 13-2) is defined as the angulation between the longitudinal bisection of the rearfoot and the longitudinal bisection of the lesser tarsus.1,2,7 In a normal lower extremity, the longitudinal axis of the lesser tarsus is abducted slightly in relation to the longitudinal axis of the rearfoot. No specific value has been determined, but 10° ± 5° is a reasonable range. Because the forefoot abducts on the rearfoot when the midtarsal joint pronates, the abducted lesser tarsus angle can become excessive. The opposite is true with midtarsal joint supination. With forefoot adduction the lesser tarsus axis comes to lie more parallel to the longitudinal axis of the rearfoot, and the angulation decreases.
As the foot moves, a greater relative positional change occurs between the lesser tarsus and the talus, as opposed to the calcaneus. There are two reasons for this. First, the design of the calcaneocuboid joint means that the midfoot and calcaneus tend to move together. Second, because of the ball-and-socket design of the talonavicular joint, more motion can occur between the talus and midfoot. In addition, the relative position of the talar and lesser tarsus axes changes as the result of motion at both the subtalar and midtarsal joints. The distal opening osteotomy of the calcaneus (Evans procedure)18 is designed to place the midfoot/forefoot anterior to the talus and ankle17 and, therefore, reduce the deformity created by the midfoot and forefoot abducting with the calcaneus away from the talus.
The Metatarsus Adductus Angle
The metatarsus angle (Figure 13-2) is defined as the angulation between the longitudinal axis of the lesser tarsus and the longitudinal axis of the metatarsus.1,2,7,19 In a normal lower extremity, the metatarsus angle is 10° to 20° adducted in relation to the lesser tarsus axis and is frequently referred to as the metatarsus adductus angle. If the adduction is greater than 20°, a deformity is present known as metatarsus adductus. Metatarsus adductus creates problems of digital alignment relative to the metatarsals. For example, the digits are more abducted relative to the metatarsals as the metatarsus adductus angle increases and the likelihood of developing hallux abductus increases.
Less frequently one finds less than 10° of metatarsus adduction. This deformity is known as metatarsus abductus, even though the axis of the metatarsus may still be adducted in relation to the axis of the lesser tarsus. For example, if the metatarsus axis is 5° adducted to the lesser tarsus axis, then metatarsus abductus deformity is present. The metatarsus abductus deformity places the forefoot weight-bearing surface farther lateral relative to the rearfoot joint axes, and, therefore, ground reactive forces on the metatarsal heads have a greater pronatory influence on the foot.20
The final point to be made about the metatarsus angle is that it remains relatively unchanged with pronation and supination. Both axes move together as components of the forefoot during pronation and supination of the foot.
An alternate method for determining the metatarsus adductus angle is to measure the angle between the longitudinal axis of the metatarsus and the longitudinal axis of the second cuneiform (instead of the lesser tarsus longitudinal axis).1,11 The second cuneiform is stable and rectangular (Figure 13-2). Engel et al.11 found that using the longitudinal axis of the second cuneiform yields an angle 3° higher than using the longitudinal axis of the lesser tarsus. Therefore, the normal range is 13° to 23° when the second cuneiform is used as the proximal reference.
The Z Foot Situation
In the Z foot alignment, three segmental reference lines are used to roughly assess foot linearity. The closer the three reference lines are to being parallel, the more stable the foot. The first of the reference lines is the base of the Z represented by the longitudinal axis of the rearfoot. The center portion of the Z is represented by the longitudinal axis of the lesser tarsus. The third and final reference line forming the Z is the longitudinal axis of the metatarsus.
In a normal foot, the longitudinal axes of the rearfoot, lesser tarsus (midfoot), and metatarsus all fall within the normal values described earlier. In the Z foot deformity, the lesser tarsus is severely abducted, and the metatarsus is adducted (see Figure 14-3 on page 237).
A Z foot is unstable because of the large angles made by three major segments of the foot. As the distal segments are compressed on the proximal segments, compression of the joints is reduced because the angular relationships make the joints nonperpendicular to the compressive force vector.
Forefoot Adductus Angle
The forefoot angle (Figure 13-2) is defined as the angulation between the longitudinal axis of the rearfoot and the longitudinal axis of the forefoot.1,2,7 A normal lower extremity generally has more metatarsus adduction than lesser tarsus abduction. Therefore, it is normal for the forefoot to be slightly adducted relative to the rearfoot (calcaneus), and is frequently referred to as the forefoot adductus angle. No normal angular value has been determined, but roughly 8° to 12° is acceptable.7
The forefoot in a stable rectus foot should be slightly abducted relative to the longitudinal axis of the talar neck and head. Therefore, the forefoot is aligned roughly in the same direction as the leg, allowing sagittal plane motion at the knee, ankle, and metatarsophalangeal joints to occur in approximately the same direction.
When the forefoot is abducted relative to the direction of gait, the metatarsophalangeal joints do not dorsiflex as much because the metatarsals roll around their longitudinal axes, as opposed to the metatarsophalangeal joint axes. This reduces foot stability because the plantar fascia is not adequately tightened.
Proximal Articular Set Angle
The proximal articular set angle (PASA) (Figure 13-3A) is defined as the angulation between a line perpendicular to the first metatarsal articular cartilage and the longitudinal axis of the first metatarsal.1,2,7,21 A perpendicular is drawn to a line that extends across the widest margin of the articular area of the first metatarsal head. Because the cartilage cannot be visualized, the margins of the denser subchondral bone plate that outline the cartilage are used.22 A second line is drawn as a longitudinal bisection of the first metatarsal. The angulation between these two lines is equal to the PASA. In a normal lower extremity, the PASA is usually 0° to 8° abducted in relation to the first metatarsal bisection.7,23 The slight lateral deviation of the articular cartilage in a normal lower extremity places the plane of motion of the first metatarsophalangeal joint approximately parallel to the line of progression. The PASA may become greatly increased through remodeling that occurs via Wolff’s law, as the hallux drifts laterally and becomes abducted relative to the first metatarsal with subsequent development of a hallux abductovalgus deformity and the associated bunion.
Amarnek et al.24 compared the PASA measured radiographically to that measured by direct visualization of the first metatarsal distal cartilage at the time of surgery. The conclusion was that the first metatarsal head articular cartilage on average deviated laterally 7° more than was demonstrated radiographically. Therefore, because of individual variation between radiographs and actual articular direction, the surgeon should use intraoperative judgment to determine how much reduction of the PASA may be necessary.
Another manner to assess the direction of the first metatarsal head articular surface is based on the concept that all the metatarsophalangeal joints should have roughly parallel planes of motion. With this concept in mind, Shechter and Doll25 developed the tangential angle of the second axis (TASA). TASA is the angle made by the cartilage on the head of the first metatarsal relative to a line perpendicular to the long axis of the second metatarsal. The normal angulation is 0° ± 5°. The TASA is frequently increased in hallux abductus deformities, just as is the PASA. Generally, the TASA equals the PASA minus the MPA angle.
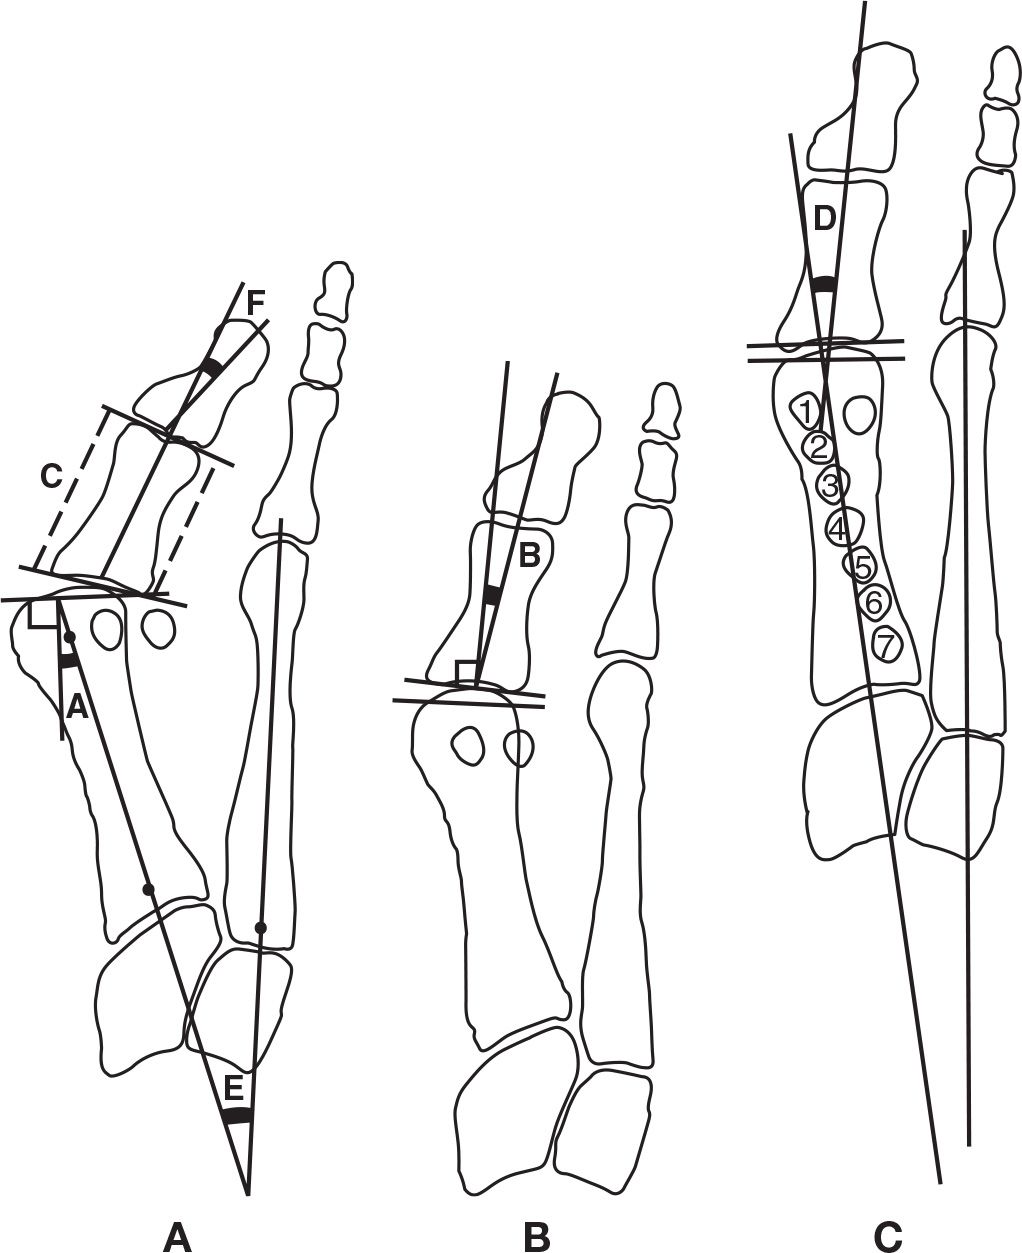
FIGURE 13-3. Quantitative methods used to evaluate first ray osseous relationships. Based on the lines connecting the medial and lateral extent of the joint cartilage, the first metatarsophalangeal joint articular cartilage relationships are described as: (A) subluxated, (B) deviated, and (C) congruous. The first metatarsal–cuneiform joint angle and shape: A has an oblique angulation and round shape; C has a small angle and is relatively flat. PASA (A); DASA (B); proximal phalanx medial and lateral length comparison (C); hallux abductus angle (D); MPA angle (E); hallux interphalangeus abductus angle (F); sesamoid positions (1–7).
Distal Articular Set Angle
The distal articular set angle (DASA) is defined as the angulation between a perpendicular to the proximal articular surface and the longitudinal bisection of the hallux proximal phalanx.1,2,7,21,26 DASA (Figure 13-3B) represents the proximal phalanx longitudinal axis relative to its proximal articular cartilage. A perpendicular is first drawn to a line that extends across the widest margin of the proximal articular surface of the hallux proximal phalanx, just as was done for the PASA. The angle between the longitudinal bisection of the proximal phalanx and the perpendicular to the proximal articular cartilage is then measured. The shaft of the proximal phalanx normally is 7° to 9° abducted in relation to the articular cartilage.2,26,27
Balding and Sorto27 found an inverse relationship between (1) the DASA and (2) the hallux abductus and MPA angles. He rationalized that this relationship developed from the increase in the DASA being caused by ground reactive forces during gait and by shoe pressure. For example, as a shoe applies an abductory force on the hallux, when the first metatarsophalangeal joint is stable, it will be the proximal phalanx that remodels consistent with Wolff’s law. If the first metatarsophalangeal joint is unstable, the abductory force increases the hallux abductus angle and secondarily the MPA angle. As hallux abductus increases, less force is exerted on the proximal phalanx and the DASA is less likely to increase.
Christman28 measured the DASA of the same phalanx in varus and valgus positions relative to normal. He found that as the proximal phalanx valgus rotates in hallux abductovalgus, the DASA decreases, and it increases as the proximal phalanx is varus rotated—an unusual occurrence. Therefore, the DASA may not be a true representation of the proximal articular cartilage relative to the shaft if the proximal phalanx is rotated.
Instead of measuring the DASA, an alternative is to measure the medial and lateral sides of the proximal phalanx.29 Lines are drawn across the most proximal and distal portions of the proximal phalanx, and then the sides are measured (see Figure 13-3). This measurement is helpful for the clinician who is considering straightening the proximal phalanx by removing a wedge of bone (e.g., distal Akin procedure).
Hallux Abductus Angle
The hallux abductus angle (Figure 13-3C) is defined as the angulation between the longitudinal bisection of the first metatarsal and the longitudinal bisection of the hallux proximal phalanx.1,2,7,21,26 In a normal lower extremity, the hallux is approximately parallel to the second toe, and 15° abducted or less relative to the first metatarsal. The range of acceptable values may be as wide as 0° to 20° depending on foot morphology.22 Ideally, the hallux abductus angle should equal the sum of the PASA and the DASA.
In assessing the hallux abductovalgus deformity, the sum of the PASA and the DASA equals the hallux abductus angle if the deformity is purely osseous in nature, that is, the articular surfaces are well aligned.26 Recall that the PASA and DASA indicate the direction in which the articular surfaces of the bones face in relation to the long axis of the respective bones. For example, if the PASA equals 8°, then the direction of articulation of the head of the first metatarsal is abducted 8° to the long axis of the first metatarsal. If the sum of the PASA and the DASA do not equal the hallux abductus angle, then a soft tissue component must be part of the deformity.26 In those strictly osseous relationships where the articular cartilages are well aligned, articular set lines will be parallel, and the joint is referred to as being congruous (Figure 13-3C).22,26 If the lines representing the proximal and distal first metatarsophalangeal joint articular surfaces are not parallel, and cross outside of the joint, the joint is said to be deviated (Figure 13-3B). If the lines cross within the joint, the joint is said to be subluxated (Figure 13-3A).30 Both deviated and subluxated joints have soft tissue components of the deformity.
According to Wolff’s law, tension stress affects bone growth and trabecular alignment. Because of this phenomenon, congruous and deviated first metatarsophalangeal joints have different subchondral structure.31 A congruous first metatarsophalangeal joint is superior to a subluxated joint both functionally and structurally as determined by gross and microscopic examination. The congruous joint has a smooth, intact articular surface and demonstrates signs of uniform stress and strain. The subchondral junction finds the cartilage and osseous tissue parallel, and the trabecular pattern is arranged evenly and perpendicular to the articular surface. The subluxated joint has an uneven articular surface, indicating uneven stress. The subchondral junction has compaction and fissuring instead of a uniform pattern. The trabecular pattern is not perpendicular to the joint surface and is distributed unevenly, with thickening in areas of greatest stress.
Consistent with this observation, Miller et al.32 demonstrated congruous joints have even stress patterns, and incongruity of the first metatarsophalangeal joint creates uneven stress across the joint and decreased joint surface contact. Specifically, congruous joints have 100% contact, whereas 10° of deviation between the proximal and distal articular surfaces results in only 50% surface area contact.
As the hallux abductus deformity increases, one frequently finds a simultaneous valgus rotation of the hallux. The clinician finds the plantar surface of the proximal phalanx increasingly visible and erroneously identifies it as the lateral aspect.
Researchers have long suspected that rounder first metatarsal heads (higher radius of curvature of the articular cartilage relative to the width of the first metatarsal, with one being normal) are more likely to have an increased hallux abductus angle than are flatter first metatarsal heads.26,33–35 Brahm35 notes that this finding is not consistent. Brahm35 theorized that when an abnormal abductory force is applied to the first metatarsophalangeal joint, an unstable joint subluxates (abducts) and a stable joint destroys itself.
McCrea et al.36 found an explanation for why flatter first metatarsal heads are not necessarily more stable than rounder heads. He found that changing the central x-ray angle from 5°, 15°, and 25° to the supporting surface makes a first metatarsal head look round, square, and square with a ridge, respectively. Therefore, if all dorsoplantar radiographs are taken at a 15° central beam angle, the declination of the metatarsal may change the shape of the metatarsal head on the radiograph, depending on whether the dorsal (round), central (square), or plantar surfaces (square with ridge) are represented on the radiograph.
The development of hallux abductus and metatarsus adductus has been attributed to first metatarsal hypermobility (dorsiflexion of the first ray by ground reactive forces during gait at a time when the first ray should be stable) as the result of foot pronation. Greenberg37 found no correlation to subtalar pronation as reflected by the talocalcaneal (when measured on the dorsoplantar and lateral views), talar declination, or calcaneal inclination angles (CIAs). He did find, however, that when abduction of the cuboid was included as an indicator of midtarsal pronation with subtalar pronation, hallux abductus and MPA angle correlated to increases in the talocuboid angle.
Metatarsus Primus Adductus (Intermetatarsal I) Angle
The MPA angle (Figure 13-3A) is defined as the angulation between the longitudinal bisections of the first and second metatarsals. In a normal lower extremity, the first metatarsal longitudinal axis is approximately 8° adducted relative to the longitudinal axis of the second metatarsal.38 The MPA angle is not considered pathologic until it becomes 12° adducted in a rectus foot and 10° adducted in an adductus foot, namely metatarsus adductus.38
It is generally accepted that the retrograde force created by an abducted hallux, once the hallux abuts the second toe, is the cause for first metatarsal adduction and the initiation of the third stage of hallux abductovalgus deformity, or MPA.15,38,39 The retrograde force created by the proximally directed pull of muscles inserting on the lateral side of the hallux is responsible for increasing hallux abduction. The hallux proximal phalanx is abducted, while the muscles of the foot maintain a posterolateral retrograde pull on this phalanx. The proximal phalanx pushes the first metatarsal medially, away from the second metatarsal in a buckling action.38 The hallux abductus angle does not appear correlated with the development of MPA.39
The reason why the increased hallux abductus angle does not correlate with MPA may be due to the association of metatarsus adductus with hallux abductus and the inverse relationship to MPA. Griffiths and Palladino40 reconfirmed an increased incidence of increased metatarsus adductus angle in feet with increased hallux abductus angles and a lower incidence in feet with normal hallux abductus angles. In addition, they found that, as the metatarsus adductus increases, the PASA increases and a slight tendency appears toward a lower MPA angle than one would expect in feet with hallux abductus and normal metatarsus adductus angles.
Several authors have suggested that the direction of the first metatarsal cuneiform joint influences the tendency for first metatarsal adduction deformity (Figure 13-3A,C). McCrea and Lichty41 confirmed numerically the observations of others42–44 by concluding that the more oblique—that is, medially directed—the first metatarsal cuneiform joint, the greater the MPA. McCrea and Lichty observed that the first metatarsal–cuneiform angle was increased and the lateral side of the first metatarsal was longer relative to the medial side in feet with increased metatarsus adductus angle, as compared to feet with normal metatarsus adductus angles. Therefore, children with longer lateral sides of their first metatarsals may be candidates for epiphysiodesis.
Medial cuneiform articular shape anteriorly also affects the tendency for metatarsus adductus. A square articular surface is generally thought to be more stable than a round one. LaPorta et al.21 and Fenton and McGlamery38 observed, and Pressman and Rice45 confirmed that, when doing soft tissue hallux abductus correction, a round first metatarsal cuneiform joint allows 2° to 4° of reduction of the MPA angle and that less reduction occurs if the joint is square.38 However, Sanicola et al.46 determined that the appearance of the hallucal tarsometatarsal joint radiographically does not represent its true anatomical structure.
The term atavistic cuneiform refers to the space between the first and second cuneiforms seen in some feet. The term atavistic was used to describe the split between the cuneiforms as remnants of a thumb-like appendage. However, the visibility of this space is positional; the more pronated the foot becomes, the more likely the space is observed. Pressman and Rice45 has found that feet with a space between the first and second cuneiform have a soft tissue component to their MPA deformity and that in these feet correction of the hallux abductus is more likely to reduce some of the MPA angle as well. Therefore, it appears that an atavistic cuneiform is a sign of an overpronated foot, and one subsequently finds that the first ray is unstable (hypermobile) in gait.
Sesamoid Position
The sesamoids should sit directly under the first metatarsal head and articulate with the first metatarsal in their respective sesamoid grooves. As the first metatarsal adducts, the sesamoids do not move, because they are anchored to the second metatarsal by the transverse metatarsal ligament. As the first metatarsal moves medially, the sesamoids are positioned lateral to their ideal position.
The tibial sesamoid position (Figure 13-3C) is a descriptive way to communicate sesamoid position relative to the first metatarsal.1,26 The longitudinal bisection of the first metatarsal is used as the reference. There are seven tibial sesamoid positions. Normally, the tibial sesamoid is medial to the first metatarsal bisection, and this is called Position 1. Position 4 is when the tibial sesamoid is centered on the bisection, and there is likely to be crista erosion (wearing away) present as well. Position 7 is when the sesamoid is completely lateral to the first metatarsal bisection and the fibular sesamoid is in the first metatarsal interspace. From Positions 3 and higher there is likely to be erosion of the first metatarsal articulation with the sesamoid.47 The sesamoid axial view should be correlated with the dorsoplantar view to assess sesamoid articulation. The sesamoids as viewed on the sesamoid axial view are frequently more laterally displaced than one might expect from a dorsoplantar view alone.
The further lateral the sesamoids are positioned relative to the first metatarsal bisection, the greater the abductory force the flexor hallucis brevis exerts on the hallux, and the less effectively the windlass mechanism performs. Poor function of the windlass mechanism is also observed when the sesamoids retract proximally after injury or surgery.
First Metatarsal Length
The changing relative length of the first metatarsal has been attributed to a variety of secondary deformities. The length of the first metatarsal is measured relative to the length of the adjacent second metatarsal (Figure 13-4A). The longitudinal bisections of the first and second metatarsals are extended proximally until they intersect.21 The distance from the intersection of the first and second metatarsal longitudinal bisections to the end of each metatarsal is measured and compared. Although ±2 mm is generally accepted as normal, the first metatarsal from a functional perspective should not be longer. As the metatarsus adductus angle increases, the first metatarsal measures and is functionally longer than in a foot with a lower metatarsus adductus angle.48 Zlotoff49 found in a study of weight-bearing radiographs that, of the first metatarsals he measured, 40% were longer, 38% were shorter, and 22% were the same length as the second metatarsal.
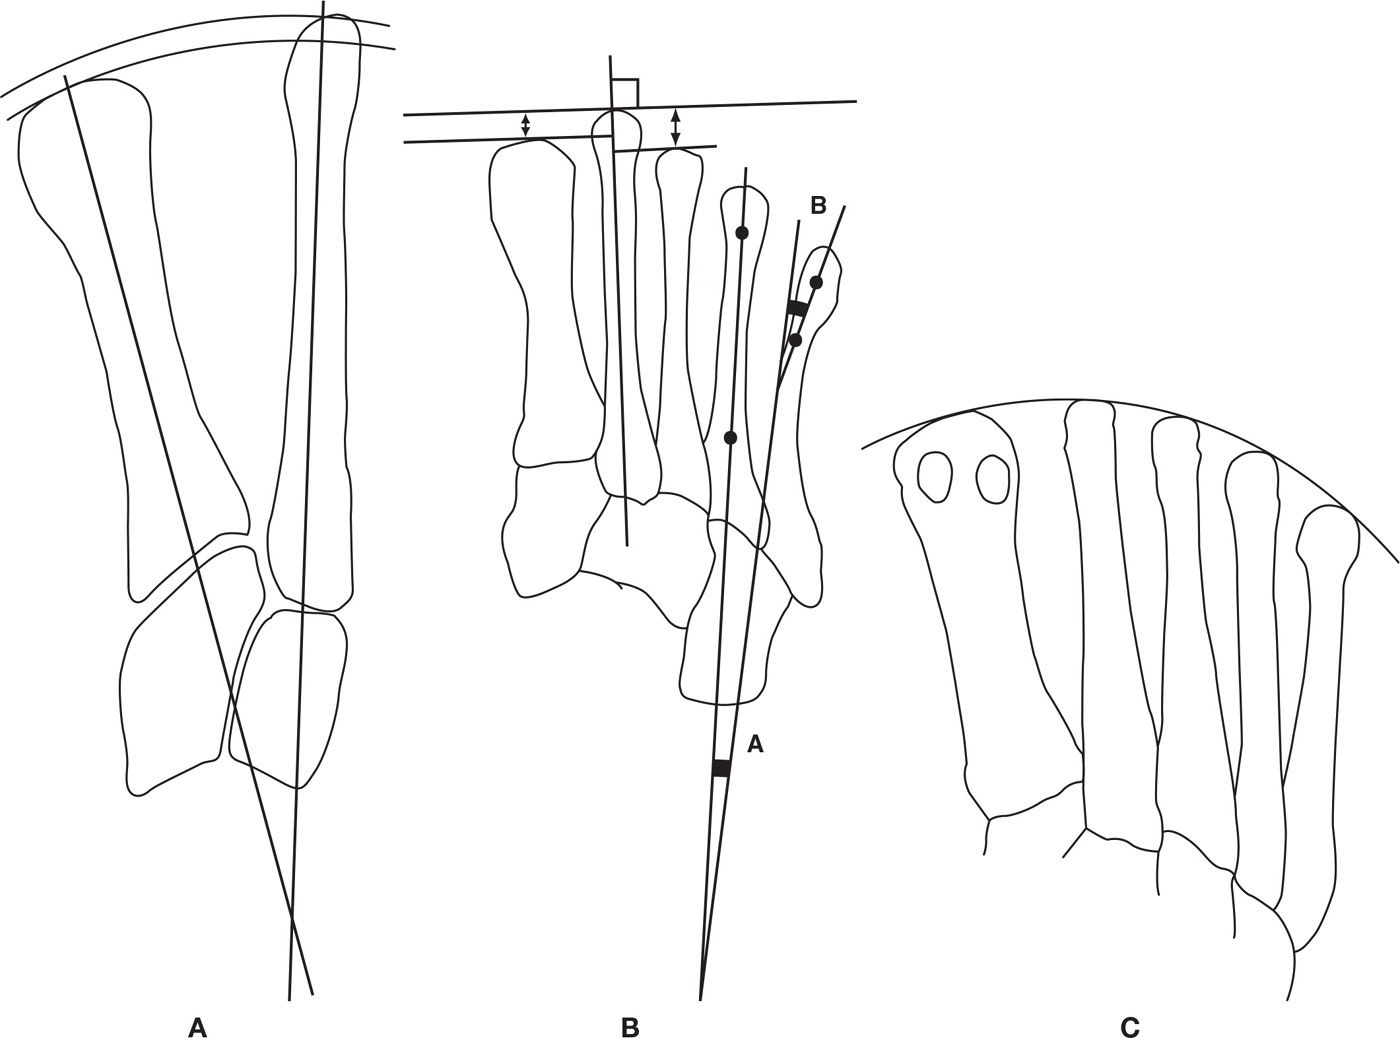
FIGURE 13-4. A: The relative length of the radius created by the distance from the intersection of the longitudinal bisections of the first and second metatarsals to their respective distal aspects where the bisections exist. B: Individual relative metatarsal length is measured using lines tangential to the distal end of the metatarsals being evaluated and perpendicular to the longitudinal bisection of the second metatarsal. Fourth intermetatarsal angle (A); fifth metatarsal lateral deviation angle (B). C: Demonstrates the distal metatarsal break pattern as a curve and not as straight lines that make an angle with the second metatarsal at the apex.
Heden and Sorto50 suggested that most hallux abductus deformities have relatively longer (protruding) first metatarsals (and longer hallux), and that those people with higher MPA angles also have protruding first metatarsals. In a study of people with hallux abductus, Duke et al.48 found that subluxated first metatarsophalangeal joints were more often associated with first metatarsals over 1 mm longer than the second, whereas congruous and deviated joints were more often associated with first metatarsals that protruded less than 1 mm or were shorter than the second metatarsal. Duke et al. also noted a tendency for hallux abductus angles over 20° to be associated with longer first metatarsals. Increased hallux interphalangeal abductus may also be associated with longer first metatarsals because there is more shoe pressure.48 Hallux varus has also been associated with relatively longer first metatarsals, as well as hallux limitus.51
In separate studies, Zlotoff49 and Schweitzer et al.52 found that the most commonly performed first metatarsal osteotomies shorten the bone by 2 to 4 mm, with a range of 0.5 to 6 mm, and that the shortening also dorsiflexes the first metatarsal because of the declination of the bone.
Short metatarsals are also associated with pathology. Morton53 described the short first metatarsal as bearing less weight, and subsequently the second metatarsal as bearing more weight, as indicated by its increased cortical thickness.54 Reduced weight bearing by the first metatarsal is frequently the etiology of second metatarsal stress fractures. Hardy and Clapham55 observed that less MPA was associated with short first metatarsals.
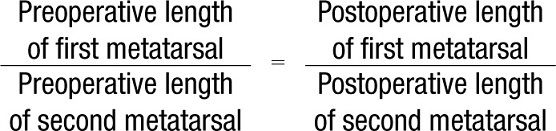
It is common that preoperative and postoperative radiographs are taken at different angles relative to the metatarsals because the postoperative radiographs are frequently taken non–weight bearing. Because of the difference in angulation of the central beam relative to the metatarsals, the metatarsals measure different lengths whether or not they have been operated on. A simple algebraic formula can be used to determine what length each metatarsal should have been if the metatarsal had not been operated.49 The actual amount of shortening is the difference between the expected length of the operated metatarsal and the length actually measured.
An alternative method for measuring relative first and second metatarsal length is to draw lines, at the ends of the first and second metatarsals, which are perpendicular to the second metatarsal longitudinal bisection (Figure 13-4B). A first metatarsal that is 2 to 4 mm shorter is appropriate.
The significance of relative first first metatarsal length is related to timely dorsiflexion of the first metatarsophalangeal joint in early propulsion and overload of the second metatarsal. It should be remembered that the first metatarsal plantar weight-bearing surface is the plantar surface of the sesamoid bones, which are not located at the distal end of the first metatarsal unless the first metatarsophalangeal joint dorsiflexes in a timely fashion during propulsion. Therefore, delay or lack of first metatarsophalangeal dorsiflexion during propulsion effectively shortens the first metatarsal.
The first metatarsal must plantarflex in order for the first metatarsophalangeal joint to dorsiflex adequately during gait.15 To plantarflex during propulsion, the first metatarsal must be shorter than the second metatarsal, hence the increased incidence of hallux valgus and limitus/rigidus associated with long first metatarsals.
The appropriate length for a first metatarsal must be taken into consideration with its position relative to the second metatarsal in the sagittal plane. A short first metatarsal cannot reach the ground functions as if it were dorsiflexed and results in overload of the second metatarsal.53 A short, plantarflexed first metatarsal may bear adequate weight to prevent second metatarsal overload.
Hallux Limitus and Rigidus
The term hallux limitus refers to reduced first metatarsophalangeal joint dorsiflexion available during gait. Hallux limitus may result from a structural or functional restriction of motion. Hallux rigidus is the end stage of structural hallux limitus, and no dorsiflexion is available because of osteoarthritis.56 Hallux limitus and rigidus are frequently associated with long first metatarsals.
The dorsoplantar radiograph provides limited information concerning hallux limitus and a bit more concerning hallux rigidus. Because functional and early stages of structural hallux limitus do not have gross morphologic changes of the first metatarsophalangeal joint, minimal radiographic signs will be observed.
Because hallux rigidus is the end stage of hallux limitus and represents degeneration of the joint, signs of osteoarthritis can be observed on the dorsoplantar view. Therefore, signs of hallux rigidus are broadening of the first metatarsal head (osteophytes) and joint space narrowing. Unless the etiology is traumatic, the etiology of hallux rigidus and hallux valgus are the same (first ray/medial column hypermobility, elevated or long first ray). Hallux rigidus occurs instead of hallux abductus in those joints that are too stable to abduct and whose lower extremities have minimal transverse plane variation from normal. In some instances, both hallux abductus and rigidus exist at the same location.
Hallux Interphalangeal Angle (Hallux Abductus Interphalangeus)
The hallux interphalangeal angle (Figure 13-3A) is defined as the angle between the longitudinal bisections of the hallux proximal and distal phalanges. In a normal lower extremity, the hallux distal phalanx is 13° abducted in relation to the proximal phalanx.57 This angulation is created by an oblique orientation of the proximal phalanx cartilage and/or asymmetrical form of the distal phalanx.58 In unshod people of Papua New Guinea, Barnett58 found the hallux abductus interphalangeus angle is 9°.58
Sorto et al.57 found that when the hallux abductus angle was less than 8°, implying a stable first metatarsophalangeal joint, the hallux abductus interphalangeus angle increased to an average of 16°. He also found that when the hallux abductus angle is over 25°, implying an unstable first metatarsophalangeal joint, the hallux abductus interphalangeus angle reduces to an average of 9°, just like the unshod individuals mentioned earlier. Given this information, Sorto et al. theorized that when the first metatarsophalangeal joint is unstable, shoe pressure will abduct the entire great toe. When the first metatarsophalangeal joint is stable, the shoe pressure creates a bend more distally in the toe. Based on the observations of Christman,28 the question can be asked as follows: Is hallux interphalangeus abductus less because the hallux is abducted and there is less pressure to create the deformity, or does the hallux abductus interphalangeus appear reduced because of the valgus rotation associated with hallux abductus?
The total lateral deviation (TLD) of the hallux is calculated by adding the hallux abductus angle and hallux abductus interphalangeus angles. Robbins39 found that when the hallux TLD is greater than 31°, the development of MPA is accelerated. Conversely, when the TLD of the hallux is less than 31°, the TLD increases at a faster rate than the MPA. Robbins hypothesized that when the hallux abuts the second toe, the abduction forces become retrograde forces that push the first metatarsal medially, instead of abducting the hallux.
The Digital Angle
The digital angle (Figure 13-2) is defined as the angulation between the longitudinal bisections of the second toe proximal phalanx and second metatarsal.1,2 The longitudinal axis of the digits and rearfoot (calcaneus) are approximately parallel in a normal foot.
Variations from normal in the transverse plane can be caused by hallux abductus pressure on the lesser digits, intrinsic muscle atrophy (such as in rheumatoid arthritis), and misalignment of the flexor and extensor tendons. As the foot pronates and supinates, the forefoot abducts and adducts, respectively. This results in misalignment of the flexor and extensor tendons, which results in adduction or abduction of the digits. The most common example of this occurrence is the adductovarus fifth toe. As the forefoot abducts, the long flexor tendon pulls from medial as opposed to from directly proximal.1 This misalignment results in adduction and varus rotation of the fifth toe.
When a digit becomes adducted or abducted relative to its metatarsal, the metatarsal will frequently move in the opposite direction because of the retrograde force. Just as in hallux abductus and the secondary MPA, correction of the digital misalignment necessitates soft tissue and possibly osseous surgical attention to correct the lesser metatarsal adduction.
In addition, midfoot stability is reduced as the flexor and extensor muscles attempt to compress the proximal phalanx onto the metatarsal head but result in adduction or abduction of the digit instead, because of the misalignment.
Sagittal plane contractures of the digits are recognized on the dorsoplantar view as reduction of metatarsophalangeal joint space because of overlap of the proximal phalanx on its respective metatarsal head, intermediate phalanx foreshortening of each phalange, “gun barrel sign” (a circular appearance of the phalanx that results from looking down the longitudinal axis of the long bone instead of looking at the bone en face), and loss of interphalangeal joint space. Observation of any of these signs indicates an extension contracture of the metatarsophalangeal joint and/or flexion contracture of the interphalangeal joint(s). With signs of metatarsophalangeal joint contracture (proximal phalanx foreshortening), retrograde force may create a downward push on the metatarsal head, resulting in corresponding excessive plantar pressure. Sagittal plane digital contracture deformities are usually associated with feet with shoe fitting problems and associated pain from excess friction on the toe box.
Because digital pathology generally becomes symptomatic as the result of wearing shoes that do not accommodate the digits and that affect digital alignment, it can be very informative to the physician and patient to take a dorsoplantar radiograph with the shoe on. This may reveal the fifth toe to underlap the fourth and may show other dramatic changes in transverse plane digital alignment resulting from shoe pressure that may not be fully appreciated with the shoes off.
Metatarsal Break and Curve
The significance of the geometric shape created by the distal ends of all metatarsals has been discussed by several authors, and to date is not well understood. Two basic principles need to be applied when evaluating this shape. First, the difference in length created by metatarsals 1 and 2 versus 2 through 5 serves a function.59 The shorter metatarsals 2 through 5 act to stabilize the lateral midfoot and function like a low gear early in propulsion as the center of force travels laterally and anteriorly through the foot in midstance and early propulsion. Once up to speed, the longer high gear of metatarsals 1 and 2 is used during propulsion as the center of force passes through the first metatarsal interspace. The longer lever created by metatarsals 1 and 2 increases the tension on the plantar fascia and, therefore, the compression within the midfoot increases at a time when ground reactive forces are the greatest.60
A second principle is related to the shape created by the gentle curve created by the distal end of the metatarsals. The metatarsal length pattern should be a curve that allows hinge motion at the metatarsophalangeal joints without imposing excessive force on any one metatarsal.61 The longer metatarsal, which does not fit the gentle curve pattern, usually bears the greatest load.61
The distal metatarsal length pattern was originally described as an angle created by a line connecting the most distal point of metatarsals 1 and 2 and a line created by connecting the most distal points of metatarsals 2 and 5.1,2,62 The average angle of 142.5° was considered normal for this metatarsal break angle. An angle lower than 142 may function fine, but lesser angles mean that the second metatarsal is unduly and likely to become overloaded. The concept to remember about this manner of assessment is that if metatarsal 2 is too long relative to the other metatarsals, the angle decreases and metatarsal 2 bears too much weight.
The next concept to evolve was describing the distal metatarsal pattern as a parabola, a constant radius curve. This was later challenged and described as a different type of symmetric curve, a conic curve.63
A more accurate description of the distal metatarsal length pattern is that of an asymmetric curve (Figure 13-4C), that is, radius changes like a French curve.64 Robbins64
Related posts:


Stay updated, free articles. Join our Telegram channel

Full access? Get Clinical Tree


